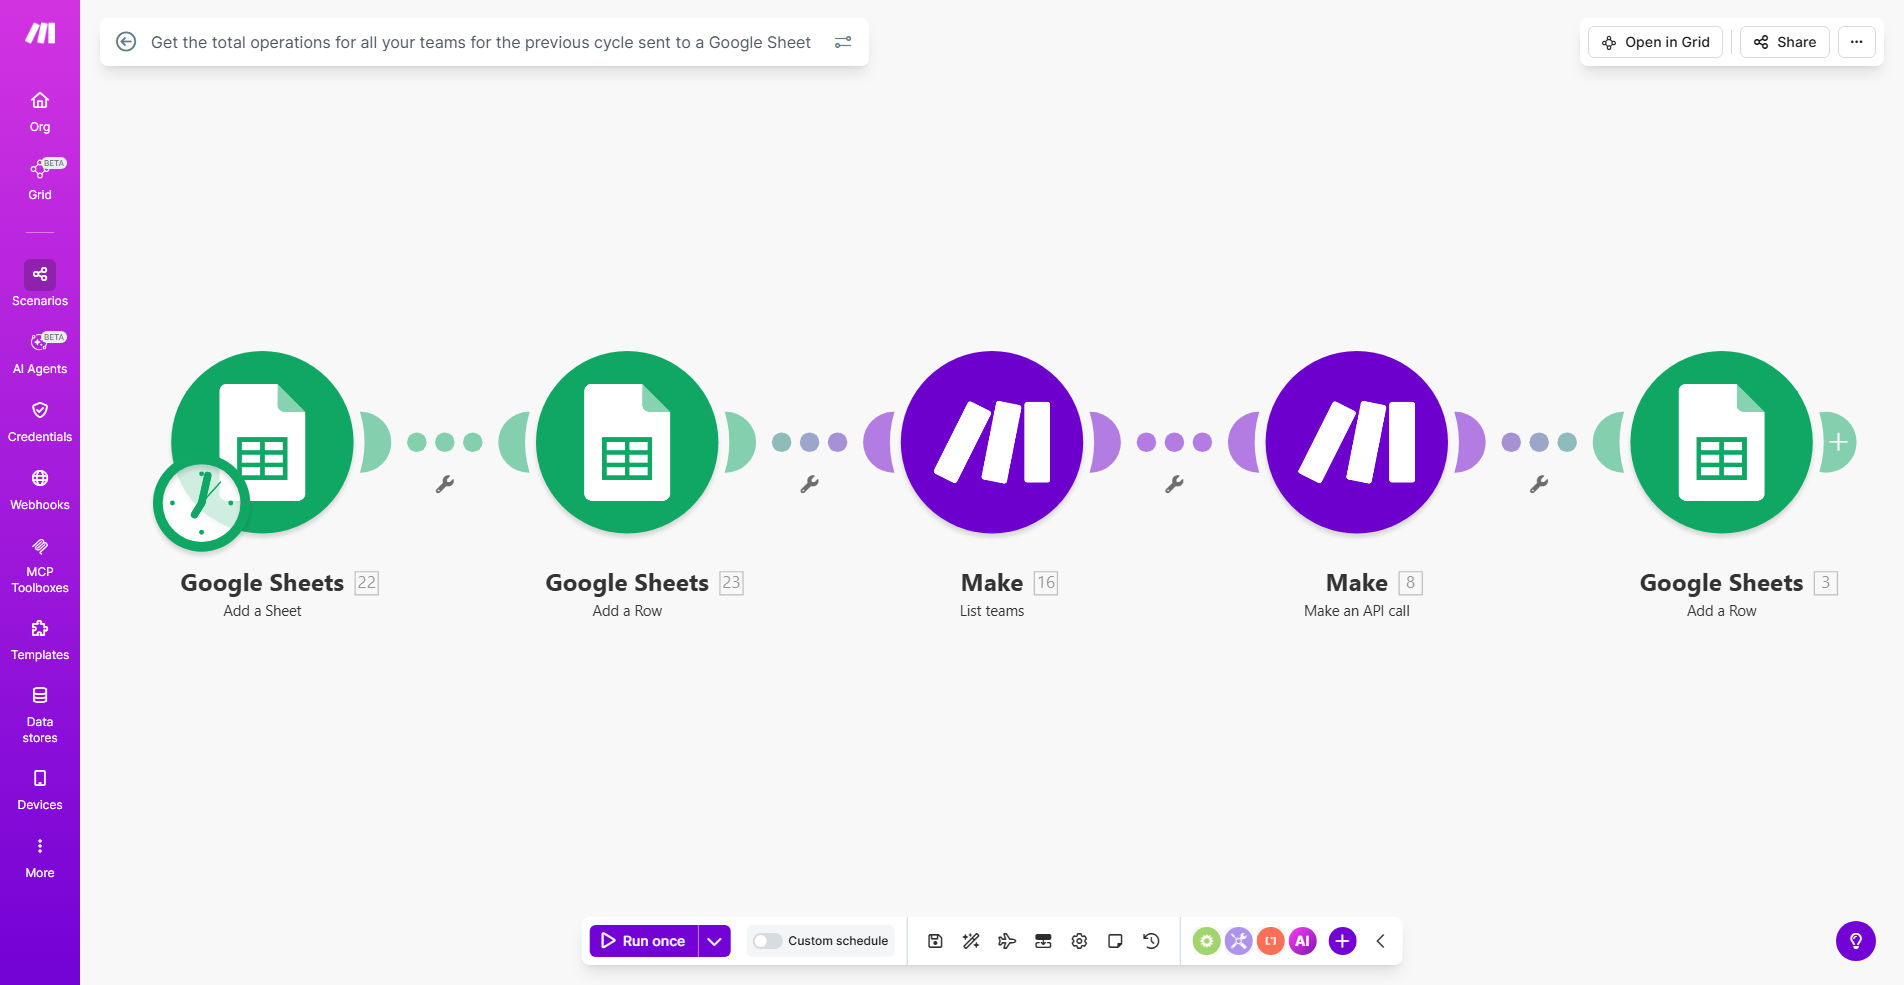
What This Workflow Does
This automation solves the time-consuming challenge of manually collecting and compiling operational metrics from multiple teams into a centralized report. Managers often waste hours each week gathering data from different departments, checking for accuracy, and formatting spreadsheets - time that could be better spent analyzing performance and making strategic decisions.
The workflow automatically aggregates key operational metrics (like tasks completed, tickets resolved, or units produced) from all your teams at the end of each cycle (daily, weekly, or monthly) and compiles them into a structured Google Sheet. It maintains historical records while providing real-time visibility into team performance across your organization.
How It Works
1. Data Collection
The workflow connects to your existing systems (CRMs, project tools, databases) to pull the latest operational metrics from each team at scheduled intervals.
2. Data Processing
It validates the data, checks for completeness, and calculates totals, averages, or other required metrics across all teams.
3. Sheet Population
The processed data gets organized into your Google Sheet with proper formatting, maintaining separate tabs or columns for different teams while showing consolidated totals.
4. Historical Archiving
Each cycle's data is timestamped and stored, allowing you to track performance trends over time without manual record-keeping.
Pro tip: Add conditional formatting in your Google Sheet to automatically highlight teams exceeding targets or falling behind expectations.
Who This Is For
This automation is ideal for operations managers, department heads, and business owners who need to track performance across multiple teams. It's particularly valuable for:
- Companies with distributed or remote teams needing centralized visibility
- Businesses tracking operational KPIs across departments
- Organizations preparing weekly/monthly performance reports
- Managers who spend excessive time compiling team metrics manually
What You'll Need
- A Make.com account (free tier available)
- A Google Sheets document set up with your desired reporting structure
- Access to the data sources containing your team metrics (APIs, exports, or integrations)
- Clear definitions of what metrics to track for each team
Quick Setup Guide
- Clone the template in your Make.com account
- Connect your data sources (CRM, project tools, databases)
- Map the fields to your Google Sheet columns
- Set your preferred schedule (daily/weekly/monthly)
- Test with a small dataset to verify formatting
- Activate the automation
Key Benefits
Save 5-10 hours per week by eliminating manual data collection and spreadsheet work, allowing managers to focus on analysis rather than data entry.
Reduce human errors in reporting with automated data validation and standardized calculations across all teams.
Gain real-time visibility into team performance with always-updated metrics available to stakeholders.
Improve decision making with accurate, timely data showing which teams need support or recognition.
Create audit trails with timestamped historical records of all operational cycles for compliance and review.