What This Workflow Does
Marketing teams often waste valuable hours each week manually exporting data from Google Analytics, copying numbers, and pasting them into spreadsheets for reporting. This process is not only tedious but also prone to errors, date mismatches, and delays that can stall strategic decisions.
This automated workflow solves that problem by acting as a reliable bridge between Google Analytics 4 (GA4) and Google Sheets. It schedules a weekly data sync—defaulting to Friday—that pulls essential metrics like user sessions, bounce rate, and conversion events directly into a structured spreadsheet. This transforms raw analytics into an accessible, living report that your entire team can use to track performance, spot trends, and justify marketing investments without needing to log into GA4.
The result is a single source of truth for your digital performance that updates itself. You move from reactive, manual reporting to proactive, data-driven management, freeing up your marketers to analyze results and optimize campaigns instead of compiling them.
How It Works
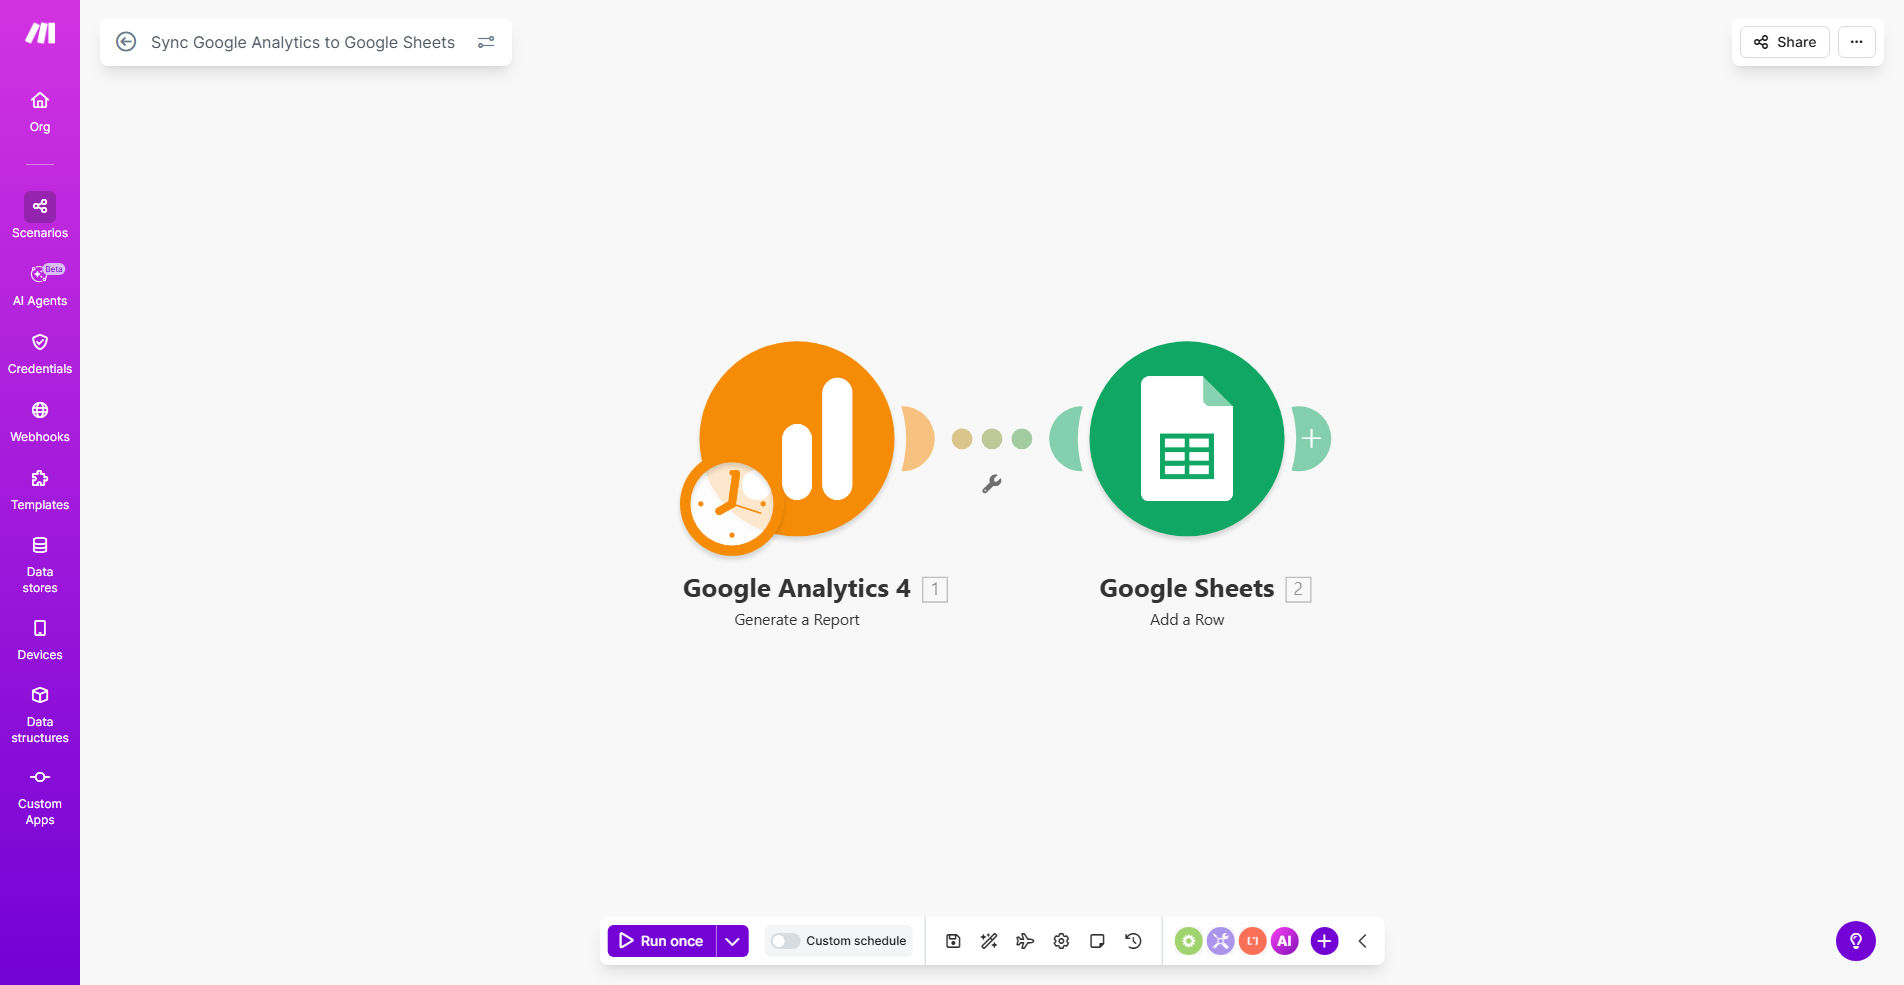
The workflow is built on Make.com and operates on a simple trigger-action principle, requiring minimal ongoing maintenance once set up.
Step 1: Scheduled Trigger
Every Friday (configurable), the Make.com scenario automatically activates. This schedule module is the starting pistol, ensuring your reporting happens consistently without anyone having to remember to run it.
Step 2: Fetch Data from Google Analytics
The scenario connects to your Google Analytics 4 property via a secure OAuth connection. It executes a predefined query to retrieve the key metrics and dimensions you care about—such as sessions by channel or conversions by landing page—for the previous complete week or month.
Step 3: Structure and Transform Data
The raw data from GA4 is then parsed and formatted. Make.com modules can calculate derived metrics (like conversion rates), filter out irrelevant data, and structure the information into clean rows and columns suitable for a spreadsheet.
Step 4: Update Google Sheets
Finally, the processed data is sent to your designated Google Sheet. The workflow can append new rows to a historical log, update a specific summary dashboard tab, or even overwrite last week's figures in a rolling report. The sheet becomes automatically updated with fresh insights.
Pro tip: Use this workflow to create a dedicated "Data Hub" sheet. Then, connect that sheet to data visualization tools like Google Data Studio or Looker Studio for automatically updating executive dashboards.
Who This Is For
This automation is a game-changer for marketing agencies, in-house marketing teams, e-commerce managers, and business owners who rely on web traffic data to guide their strategy. It's perfect for anyone who currently spends more than an hour a week manually reporting on website KPIs.
Specifically, it benefits:
- Marketing Directors who need to report on campaign ROI to leadership.
- SEO & Content Specialists tracking organic traffic and engagement trends.
- Digital Agencies that must provide clear, consistent performance reports to multiple clients.
- Startup Founders wearing multiple hats who need automated insights to make quick, informed decisions.
What You'll Need
- A Make.com account (free tier is sufficient to run this workflow weekly).
- Administrator access to a Google Analytics 4 (GA4) property where your website data is tracked.
- A Google Sheets document where you want the data to land. You can use an existing report or create a new one.
- Basic knowledge of which GA4 metrics (e.g., sessions, conversions) and dimensions (e.g., source/medium, page title) you want to report on.
Quick Setup Guide
You can have this automation running in under 20 minutes.
- Clone the Template: Click "Get This Workflow" and duplicate the provided Make.com scenario into your own account.
- Connect Your Apps: In the scenario, update the connections (called "modules") to authorize access to your specific Google Analytics and Google Sheets accounts.
- Configure the Query: Point the Google Analytics module to your correct GA4 property ID and define your desired date range (e.g., "last week") and metric set.
- Set Your Sheet: In the Google Sheets module, paste the URL of your target spreadsheet and specify the exact sheet name and cell range where data should be added.
- Test & Schedule: Run a single test execution to ensure data flows correctly into your sheet. Then, set the schedule to your preferred day and time (e.g., every Monday at 9 AM).
Key Benefits
Save 5-10 hours per month on manual reporting. Eliminate the weekly grind of logging in, exporting CSVs, and reformatting data. This time can be redirected towards actual analysis and strategy.
Improve data accuracy and timeliness. Automated syncs remove human error from copy-paste processes and ensure reports are always ready with the latest data, leading to more confident decision-making.
Democratize data access across your team. By having key metrics in a shared Google Sheet, team members without GA4 access can monitor performance, fostering a more data-literate culture.
Create a historical performance archive. The workflow can append data weekly, building a valuable long-term dataset in your sheet perfect for year-over-year trend analysis and forecasting.
Build a foundation for advanced dashboards. With clean, automated data flowing into Sheets, you can easily connect it to BI tools like Looker Studio or Tableau to create powerful, real-time executive dashboards.