What This Workflow Does
Manual weekly reporting is a silent productivity killer. Marketing teams, product managers, and agency owners spend hours every week copying numbers from Google Analytics into spreadsheets, formatting them, and then emailing summaries that often go unread. This process is not only time-consuming but also prone to errors and delays, leaving teams reacting to stale data.
This automated workflow solves that by creating a seamless pipeline from data source to decision-makers. Every week (or on any schedule you choose), it automatically extracts key performance indicators from your Google Analytics property, structures them into a record in Airtable for historical tracking and analysis, and then posts a clear, actionable summary directly into a designated Slack channel. This transforms reporting from a chore into a consistent, reliable, and collaborative asset.
The business value is immediate: reclaim 2-5 hours per week per team member, eliminate spreadsheet errors, ensure everyone is working from the same single source of truth, and foster a culture where data-driven discussions happen naturally in the flow of work.
How It Works
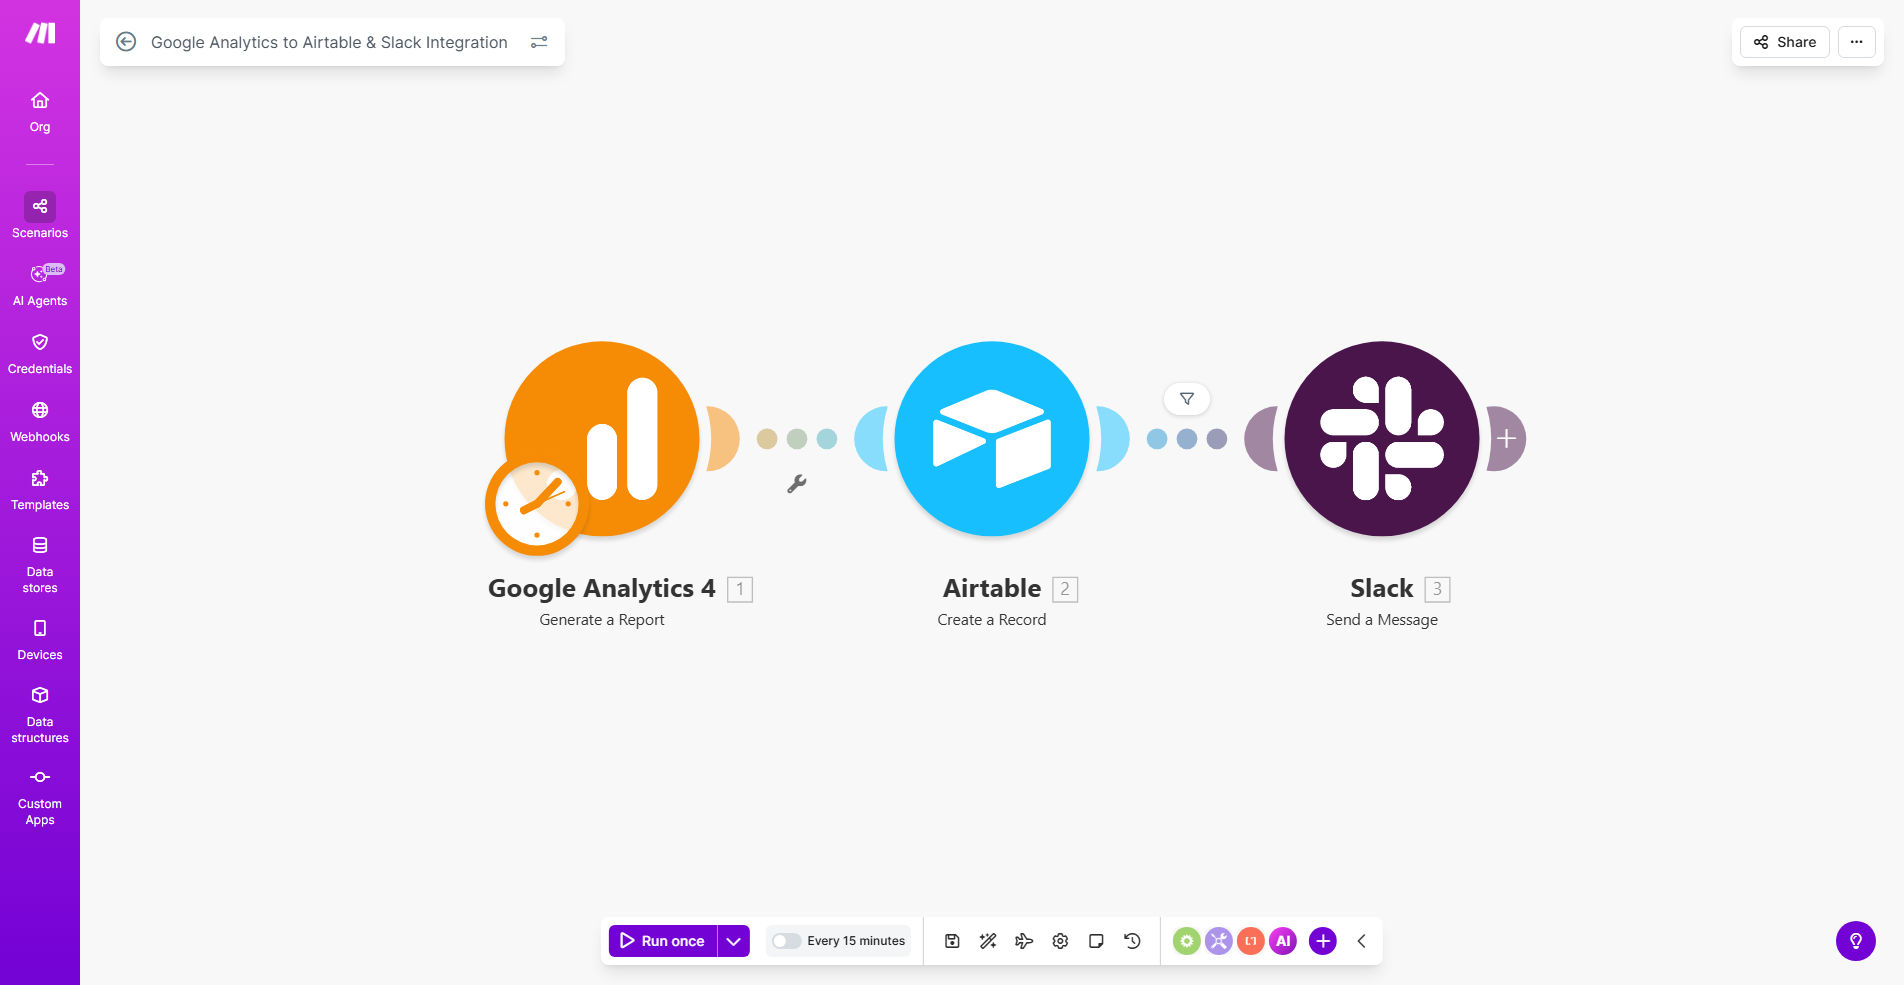
The automation acts as a intelligent bridge between three powerful platforms, orchestrating a flow of information that requires zero manual intervention once set up.
Step 1: Scheduled Trigger & Data Fetch
The scenario is triggered on a schedule, defaulting to every Friday. It then connects to your Google Analytics 4 (GA4) property via the official API. You specify exactly which metrics (e.g., users, sessions, engagement rate, conversions) and dimensions (e.g., date, source/medium, page title) you want to retrieve for the past week.
Step 2: Data Structuring in Airtable
The raw data from Google Analytics is then mapped and sent to a pre-configured Airtable base. Each weekly report becomes a new record, with metrics neatly organized into fields. This builds a rich, queryable history of your website's performance over time, perfect for creating dashboards or spotting long-term trends.
Step 3: Insightful Notification in Slack
Finally, the workflow formats the most critical metrics and insights into a readable message and posts it to a Slack channel of your choice. This could be a general #marketing channel, a dedicated #website-performance channel, or a leadership team channel. The notification highlights changes from the previous period, putting the data into immediate context for your team.
Pro tip: Use Airtable's formula fields to automatically calculate week-over-week or month-over-month growth percentages from the historical data this workflow populates. This turns your base into a self-updating analytics dashboard.
Who This Is For
This automation is a game-changer for any business or team that relies on website data to inform decisions. It's particularly valuable for:
- Marketing Teams & Agencies: Automate client reporting, track campaign performance, and keep internal teams aligned on traffic and conversion goals.
- Product Managers & Startup Founders: Monitor user engagement, feature adoption, and overall product health without constantly logging into analytics.
- E-commerce Managers: Track traffic sources, session quality, and conversion paths that lead to sales.
- Content Teams & Publishers: Understand which content drives the most engagement and audience growth over time.
- Consultants & Freelancers: Provide transparent, automated reporting to clients as a value-added service.
What You'll Need
To implement this template, you'll need active accounts and a few minutes for configuration:
- A Make.com account (free tier available).
- A Google Analytics 4 (GA4) property with data, and "Editor" permissions to connect the API.
- An Airtable account and a base with a table ready to receive the data (the template provides a suggested structure).
- A Slack workspace where you have permission to create webhooks or install apps to post messages.
Quick Setup Guide
You can have this automation running in under 30 minutes by following these steps:
- Clone the Template: Click "Get This Workflow" to copy the scenario into your Make.com account.
- Connect Your Apps: In the Make.com scenario editor, update the connections (modules) for Google Analytics, Airtable, and Slack using OAuth. This is a simple click-to-authorize process.
- Configure Data Pull: In the Google Analytics module, input your GA4 Property ID and specify the exact metrics and date range (e.g., "last 7 days") you wish to report on.
- Map to Airtable: Point the Airtable module to your base and table. Map the incoming data fields from Google Analytics to the corresponding columns in your Airtable.
- Set Up Slack Alert: Configure the Slack module with your desired channel and customize the message format. You can use placeholders to insert dynamic metric values.
- Test & Schedule: Run a single test execution to ensure data flows correctly. Then, set your preferred schedule (weekly, daily, monthly) and activate the scenario.
Key Benefits
Save 5-10 hours monthly on manual reporting. Eliminate the tedious copy-paste-format-email cycle forever, freeing your team to focus on analysis and action.
Improve decision speed with real-time, accessible data. When insights are posted directly in Slack, discussions and decisions happen in minutes, not days after a report is circulated.
Build a historical performance database effortlessly. Airtable becomes your searchable, single source of truth for all historical web metrics, enabling powerful trend analysis and forecasting.
Reduce errors and ensure consistency. Automated data transfer removes human error from the equation and guarantees every report follows the exact same format and logic.
Enhance cross-team transparency and alignment. Sharing key metrics openly in Slack keeps marketing, product, sales, and leadership on the same page, fostering a unified, data-driven culture.