What This Workflow Does
For digital marketers and business owners, manually checking Facebook Ads Manager and copying numbers into a spreadsheet is a tedious, error-prone chore. This process can eat up 5-10 hours every week—time that should be spent analyzing performance and optimizing campaigns, not on data entry.
This automation solves that problem by creating a seamless bridge between Facebook Ads and Google Sheets. It runs on a schedule you set (typically daily), fetches the latest performance metrics for your campaigns, and appends them as new rows in your designated Google Sheet. The result is a clean, timestamped log of your advertising performance, always up-to-date and ready for analysis.
Beyond saving time, it creates a single source of truth. No more wondering if the numbers in your report are correct or current. Your entire team can work from the same live data in Google Sheets, enabling faster, more confident decisions about where to allocate your advertising budget.
How It Works
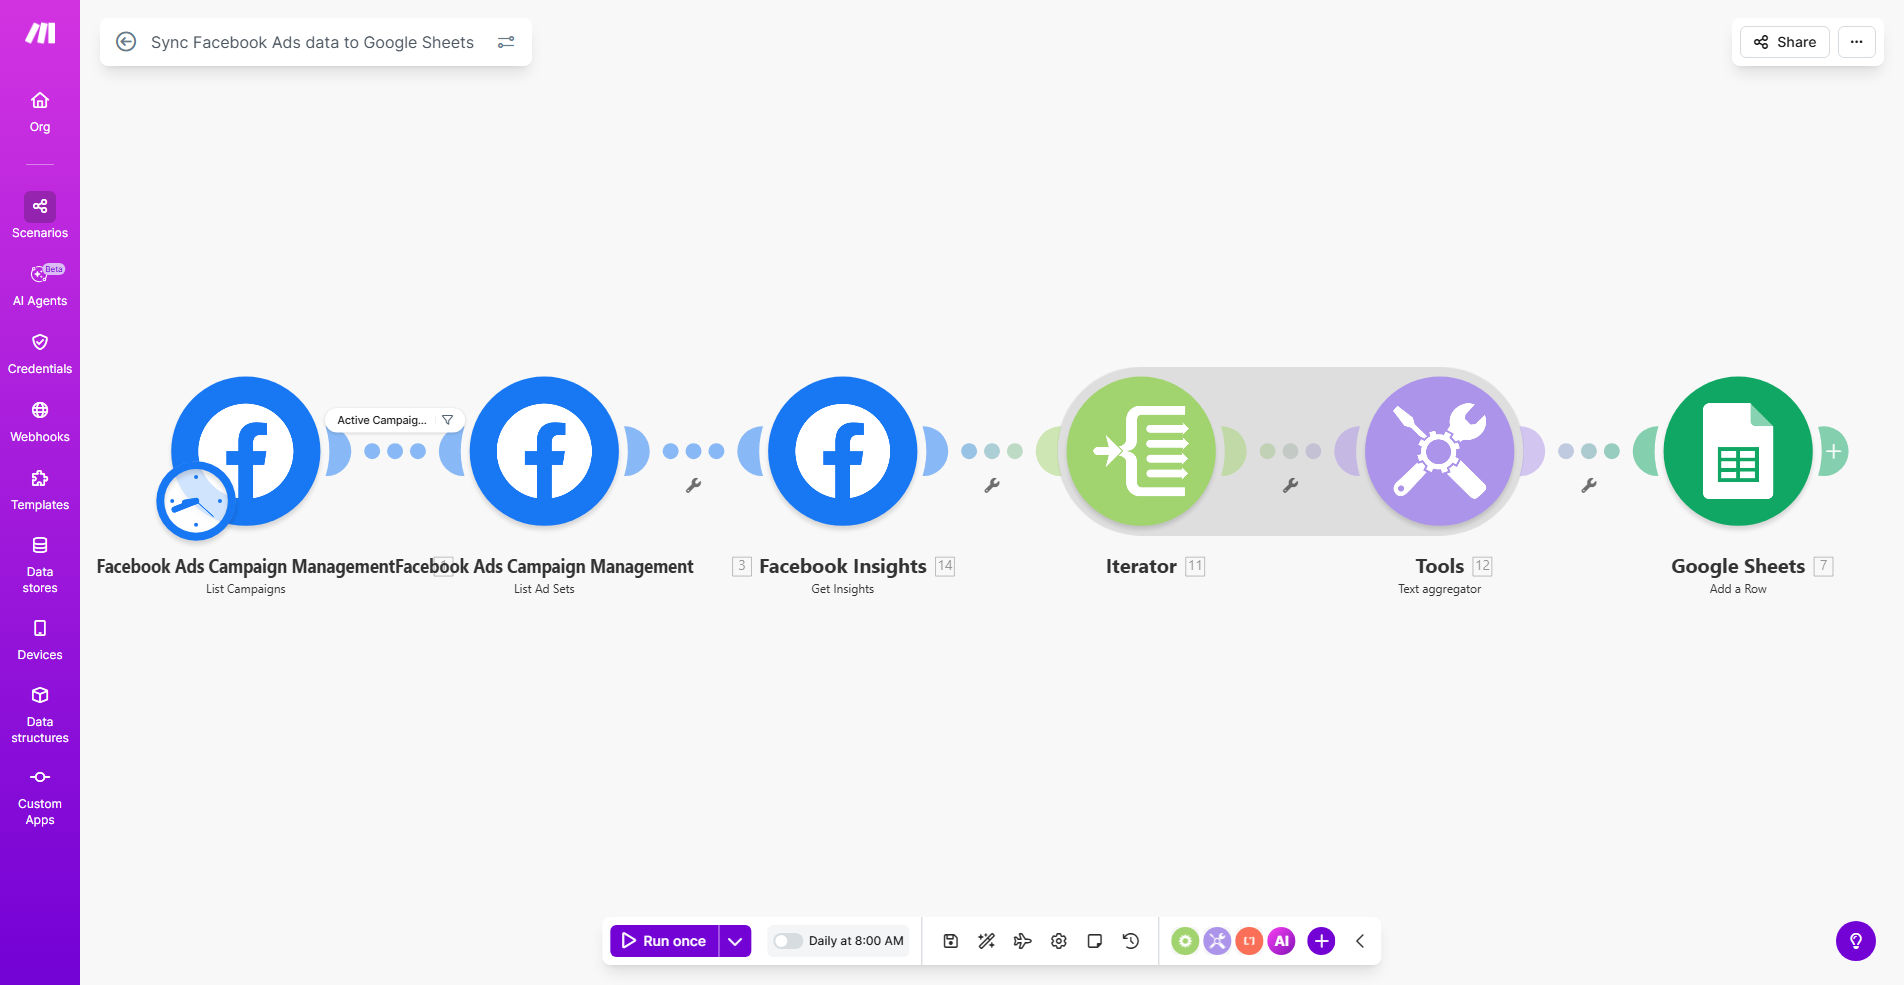
The workflow is built on Make.com and operates on a simple "trigger → action" principle. Once set up, it runs automatically in the background.
Step 1: Scheduled Trigger
The automation is initiated by a schedule module. You configure it to run at a specific time each day (e.g., 2:00 AM). This ensures your data is pulled after the previous day's performance has been fully recorded by Facebook.
Step 2: Fetch Data from Facebook Ads
Make.com connects to your Facebook Ads account via the Meta Marketing API. It requests the performance data for the specified date range (usually "yesterday") and retrieves key metrics for each active campaign, ad set, or ad.
Step 3: Transform and Map the Data
The raw data from Facebook is processed. The workflow maps each metric (like impressions, clicks, spend, conversions) to a corresponding column in your Google Sheet. It can also calculate derived metrics, such as Cost Per Result or ROAS, on the fly before sending the data.
Step 4: Add Rows to Google Sheets
Finally, the formatted data is sent to Google Sheets. The automation adds a new row for each campaign or data point, including the date of the report. Your spreadsheet grows automatically, building a complete historical record without any manual input.
Pro tip: Structure your Google Sheet with separate tabs for raw data and summary dashboards. Let the automation feed the raw data tab, then use Google Sheets formulas or connected tools like Looker Studio to create visual reports. This keeps your automation simple and your reporting powerful.
Who This Is For
This template is a game-changer for any business investing in Facebook and Instagram advertising.
Digital Marketing Agencies: Manage multiple client accounts efficiently. Sync data for all clients into a master sheet or separate workbooks, standardizing reporting and saving countless hours each month.
E-commerce Brands & DTC Businesses: Get daily visibility into your ad spend versus sales revenue (ROAS). Quickly identify which products or audiences are driving the best results and adjust budgets in real-time.
Lead Generation Businesses: Track cost per lead daily across different campaigns and ad sets. Correlate ad spend with CRM data to understand the full funnel efficiency.
Solo Entrepreneurs & Small Teams: Eliminate the manual reporting task that steals your focus. Free up time to work on strategy, creative, or other high-value business activities.
What You'll Need
- A Make.com account (free tier is sufficient to run this workflow on a daily schedule).
- A Facebook Business Manager account with Ads access and an active ad campaign.
- A Google account with access to Google Sheets (or the ability to create a new Sheet).
- (Recommended) A basic understanding of the key Facebook Ads metrics you want to track (e.g., Spend, Impressions, Conversions).
Quick Setup Guide
Getting this automation live takes about 15 minutes. Follow these steps:
- Get the Template: Click the "Get This Workflow" button above. It will open the template in your Make.com account.
- Create a Copy: Inside Make.com, you'll be prompted to create a copy of the scenario into your own workspace.
- Connect Facebook Ads: Click on the Facebook Ads module. You'll be asked to authorize Make.com to access your Facebook Ads data. Follow the standard OAuth login process.
- Connect Google Sheets: Similarly, authorize the connection to your Google account so the workflow can write to your Sheets.
- Configure the Modules: Specify the Facebook Ad Account, date range (usually "Yesterday"), and the metrics you want to pull. Then, point the Google Sheets module to the exact spreadsheet and worksheet where the data should go.
- Test & Activate: Run the scenario once manually to ensure data flows correctly into your Sheet. If all looks good, turn on the schedule to automate it daily.
Key Benefits
Save 5-10 Hours Per Week on Manual Reporting. Eliminate the daily or weekly ritual of logging into Ads Manager, exporting CSVs, and copying data. That time is now reclaimed for strategic work.
Eliminate Human Error in Data Entry. Manual copying leads to typos, misplaced decimals, or forgotten campaigns. Automation guarantees 100% accuracy and consistency in your data records.
Gain Real-Time Visibility for Faster Decisions. With data syncing daily, you can spot a underperforming campaign within 24 hours and pause it or shift budget, potentially saving hundreds in wasted ad spend.
Create a Centralized, Historical Performance Database. Your Google Sheet becomes a searchable, filterable archive of all campaign performance. This is invaluable for quarterly reviews, forecasting, and proving marketing ROI.
Empower Your Team with Live Data. Share the Google Sheet with your team or client. Everyone works from the same, constantly updated numbers, improving communication and alignment.