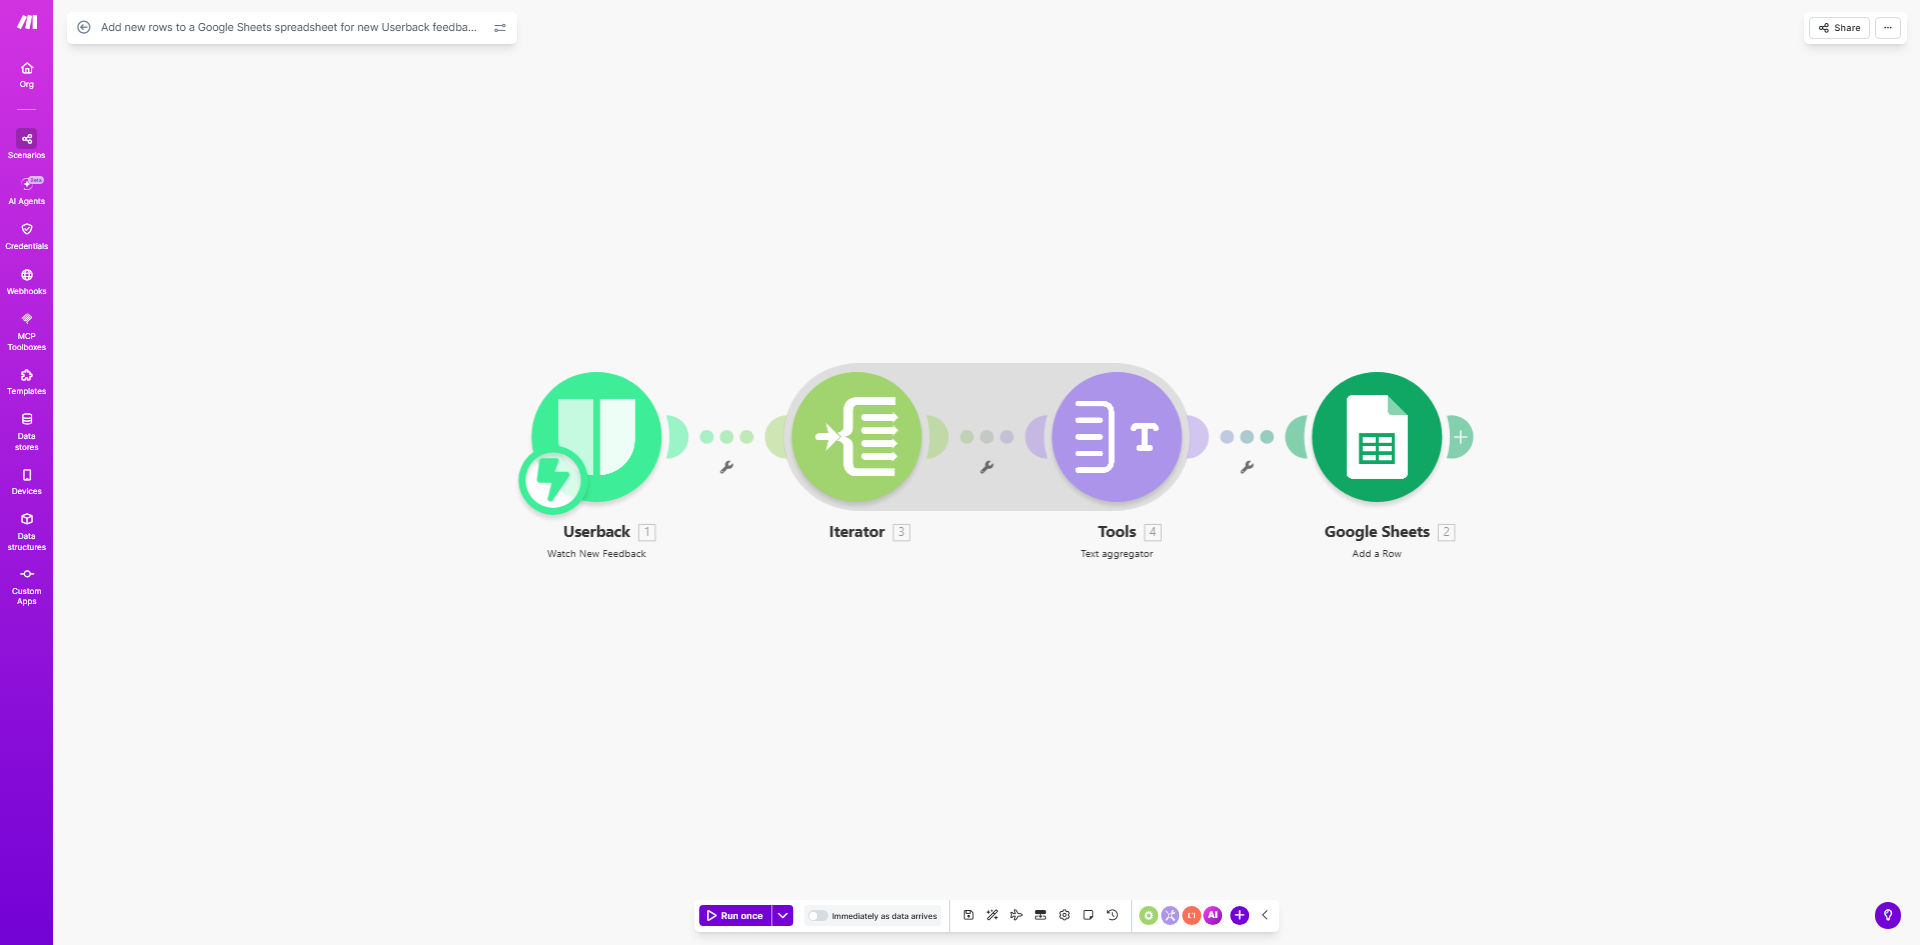
What This Workflow Does
For product teams using Userback, valuable user feedback often arrives in a siloed tool, making it difficult to analyze trends, share insights, or track issues over time. Manually copying this data into a spreadsheet is a repetitive, time-consuming task that leads to missed feedback and inconsistent data.
This Make.com automation solves that by creating a seamless bridge between Userback and Google Sheets. Every time a user submits feedback—be it a bug report, feature request, or general comment—the workflow instantly captures all relevant details and adds them as a new, structured row in your designated Google Sheets spreadsheet. This transforms scattered feedback into a centralized, analyzable database.
The result is a live log of user insights that your entire team can access. Product managers can prioritize roadmaps, support teams can identify recurring issues, and executives can gauge user sentiment—all from a single, always-up-to-date source.
How It Works
The workflow operates on a simple trigger-action principle, ensuring no feedback slips through the cracks.
Step 1: New Feedback Trigger in Userback
The workflow is initiated the moment a new feedback item is created in your Userback project. Make.com monitors your Userback account in real-time, waiting for this specific event.
Step 2: Data Extraction & Mapping
Make.com retrieves the full payload of data from the new feedback. This includes the feedback title, detailed description, URL where it was submitted, user information (like email), browser/device details, attached screenshots, and the precise timestamp.
Step 3: Row Creation in Google Sheets
The workflow then connects to your pre-defined Google Sheets spreadsheet and appends a new row. Each piece of extracted data is mapped to a specific column—creating a clean, organized record that is immediately ready for sorting, filtering, and analysis.
Pro tip: Structure your Google Sheet with columns for 'Priority', 'Status', and 'Assigned To'. You can later extend this automation to automatically assign a priority score based on keywords or route high-priority items to a Slack channel.
Who This Is For
This automation is a game-changer for product-led companies and teams that rely on user input to guide development.
Product Managers & Owners: Centralize feedback to spot trends, validate feature ideas, and build data-driven roadmaps without manual data gathering.
Customer Support Teams: Quickly identify and track common user issues or bugs, improving response times and resolution rates.
UX/Design Teams: Gain a searchable repository of user pain points and suggestions to inform design decisions and usability improvements.
Startups & SaaS Companies: Maintain a tight feedback loop with users without adding administrative overhead, crucial for agile development and customer retention.
What You'll Need
- A Make.com account (free tier available).
- A Userback account with an active project collecting feedback.
- A Google Sheets spreadsheet set up with column headers for the data you want to capture (e.g., Date, User Email, Feedback, URL, Status).
- API connection access for both Userback and Google Sheets (handled via Make.com's built-in modules).
Quick Setup Guide
You can have this automation running in under 15 minutes.
- Clone the Template: Click the "Get This Workflow" button to copy the template into your Make.com account.
- Connect Userback: In the first module, authorize Make.com to access your Userback account and select the specific project you want to monitor.
- Connect Google Sheets: In the second module, authorize access to Google Drive/Sheets and select the exact spreadsheet and worksheet where rows should be added.
- Map the Data: Review the data mapping. The template is pre-configured, but you can customize which Userback fields go into which spreadsheet columns.
- Test & Activate: Turn on the scenario and submit a test piece of feedback in Userback. Verify that a new row appears in your sheet with all the correct data.
Key Benefits
Eliminate 5-10 hours of manual work per week previously spent copying and pasting feedback from Userback into spreadsheets. This time is now freed for higher-value analysis and strategic work.
Ensure 100% feedback capture with zero human error or oversight. Every single submission is logged instantly and consistently, creating a complete historical record.
Improve cross-team collaboration by providing product, support, and development teams with a single, shared source of user truth, reducing silos and miscommunication.
Enable powerful data analysis by having structured, sortable data in Google Sheets. Use filters, pivot tables, and charts to identify top requested features, most common bugs, and user sentiment trends.
Create a foundation for advanced automation by using this logged data as a trigger for other processes, like creating Jira tickets for bugs or sending thank-you emails to feedback providers.