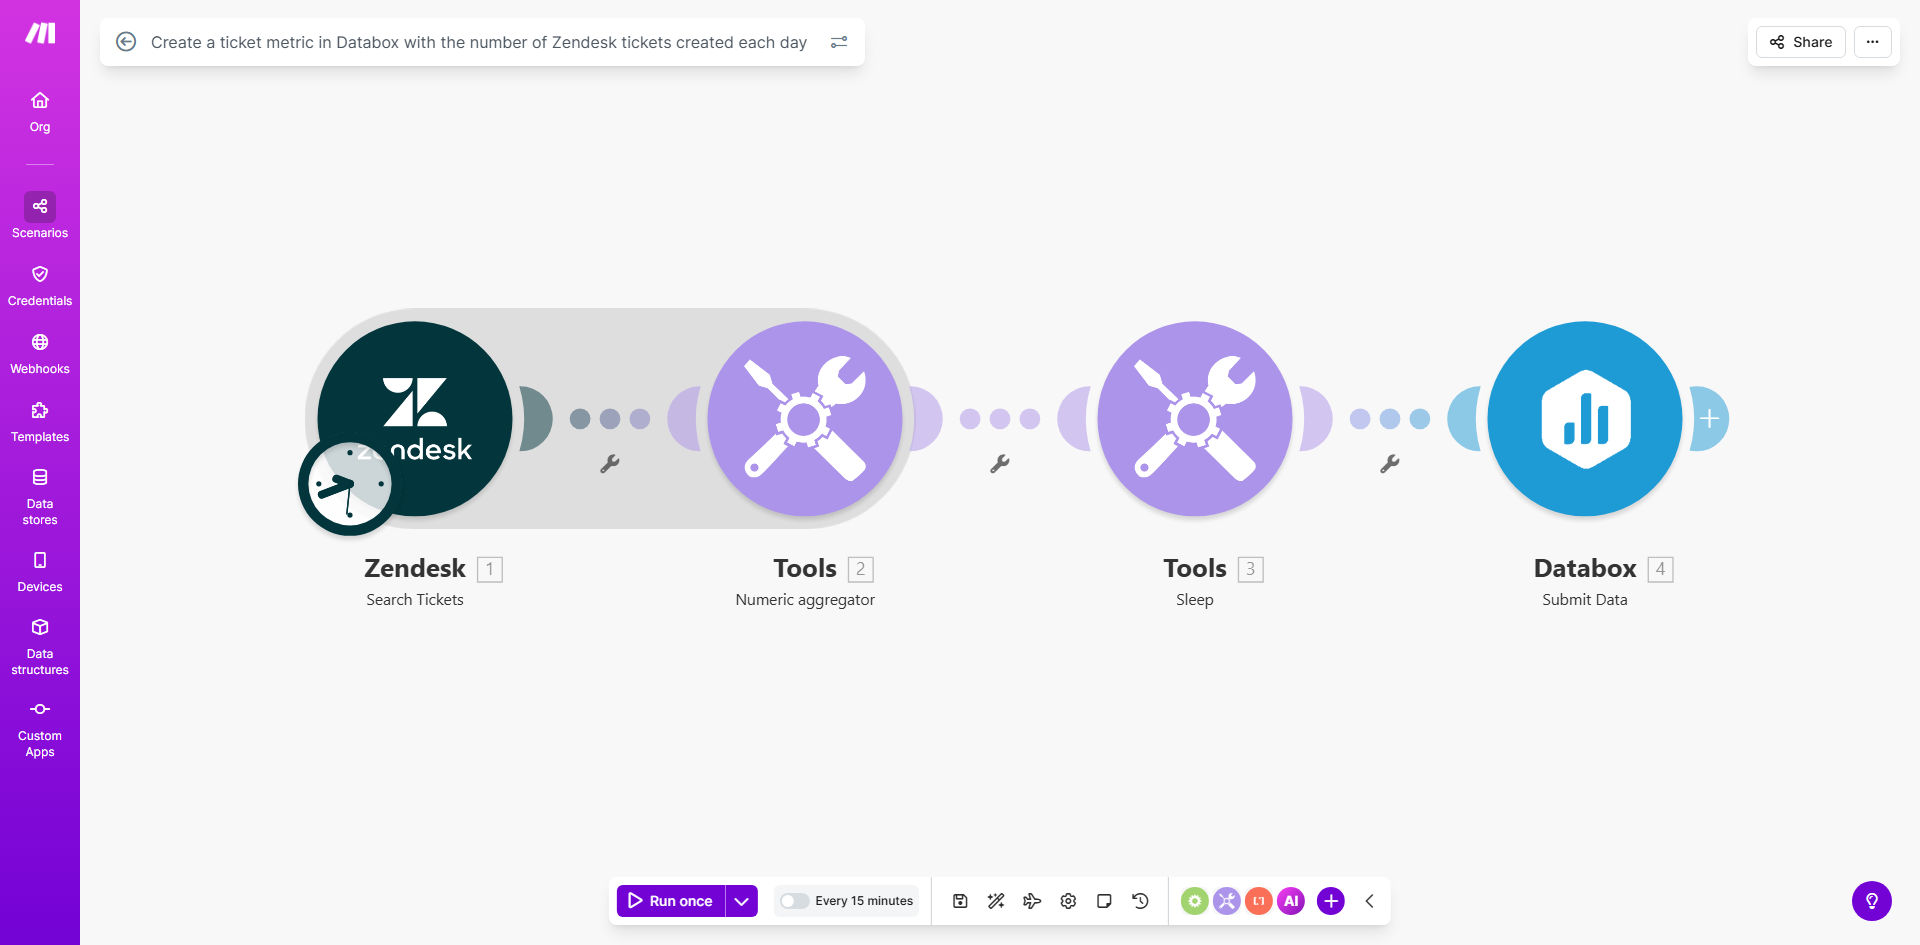
What This Workflow Does
Customer support teams often struggle to translate daily ticket volume into actionable business intelligence. Manually counting tickets and updating dashboards is time-consuming, error-prone, and creates lag in decision-making. This automation solves that by seamlessly connecting Zendesk, your support hub, with Databox, your visualization platform.
The workflow automatically queries your Zendesk instance, counts the number of tickets created each day, and pushes that metric directly into your designated Databox dashboard. It processes all historical tickets in a one-time run to establish a baseline, after which you can use a companion daily update workflow to keep the metric current. This provides leadership with an always-accurate, visual representation of support demand trends.
How It Works
The automation follows a logical sequence to ensure data accuracy and seamless integration between the two platforms.
Step 1: Trigger & Date Range Setup
The scenario can be triggered manually for the initial historical import. You define the date range for which you want to process tickets, allowing you to backfill data for weeks, months, or even years.
Step 2: Fetch Tickets from Zendesk
Using the Zendesk API module, the workflow retrieves all tickets created within the specified date period. It handles pagination automatically to ensure no ticket is missed, regardless of volume.
Step 3: Aggregate & Count by Day
The core logic of the workflow groups the retrieved tickets by their creation date. It then counts how many tickets were created on each individual day within your selected range.
Step 4: Push Metric to Databox
For each unique day, the workflow sends the corresponding ticket count to Databox via its API. It creates or updates a specific metric in your connected Databox account, tagging each data point with the correct date.
Pro tip: Run this template once to establish your historical baseline. Then, schedule the separate "daily update" template to run automatically each morning, ensuring your dashboard reflects yesterday's volume without any manual intervention.
Who This Is For
This automation is ideal for customer support managers, operations leaders, and business executives who rely on data to make informed decisions. It's perfect for SaaS companies, e-commerce support teams, and any business using Zendesk for ticketing that wants to elevate their reporting game.
If you're tired of weekly manual spreadsheet reports or if your team debates whether support volume is "up" or "down" based on gut feeling, this workflow provides the single source of truth. It's also invaluable for companies preparing for investor reviews, board meetings, or internal quarterly business reviews where support performance metrics are scrutinized.
What You'll Need
- A Make.com account (free or paid plan) to host and run the automation.
- Admin or API access to your Zendesk account to generate API credentials.
- A Databox account with a project or dashboard ready to receive the new metric.
- API keys or OAuth credentials for both Zendesk and Databox to authenticate the connection in Make.com.
- (Recommended) A basic understanding of how to duplicate and activate a public template within Make.com.
Quick Setup Guide
You can have this automation running in under 15 minutes by following these steps.
- Get the Template: Click the "Get This Workflow" button above to open the template in your Make.com account and create a copy.
- Connect Zendesk: In the first module, click to add a connection. Use your Zendesk subdomain and API token to authenticate the app.
- Connect Databox: Similarly, authenticate the Databox module with your account credentials or API key from the Databox developer settings.
- Configure the Metric: Specify the exact name for your new metric in Databox (e.g., "Daily Zendesk Tickets").
- Set the Date Range: For the initial run, define the start and end dates for your historical data import.
- Test Run: Run the scenario once manually to verify it fetches tickets and posts data to Databox correctly.
- Schedule Updates (Optional): Once confirmed, set up the separate daily update template on a schedule to run every 24 hours automatically.
Key Benefits
Eliminate 2–3 hours of manual reporting work each week. By automating the daily ticket count, support managers and analysts reclaim time previously spent on repetitive data compilation, allowing them to focus on strategic improvements and team coaching.
Gain real-time visibility into support demand spikes. A sudden increase in tickets becomes immediately visible on your Databox dashboard, enabling proactive resource allocation—like pulling in extra agents—before customer satisfaction scores are impacted.
Create a reliable historical trend line for capacity planning. Accurate daily data over months allows you to forecast future support needs based on seasonal patterns, product release cycles, or business growth, leading to better hiring and budgeting decisions.
Improve cross-departmental communication with data. A shared, automated dashboard in Databox provides product, engineering, and marketing teams with objective data on how changes affect support volume, fostering a more data-driven company culture.
Ensure 100% data accuracy and consistency. Automation removes human error from the counting and entry process. Your dashboard metrics are always calculated the same way, making period-over-period comparisons truly valid and trustworthy.