Make.com Google Analytics Google Sheets Marketing Automation Data Reporting

Automate Google Analytics Reporting to Google Sheets

Stop wasting hours on manual reports. This free template automatically pulls your key website metrics into a spreadsheet for easy analysis and sharing.

Get This Workflow Make.com · Google Analytics · Free Template
Visual diagram of a Make.com automation workflow connecting Google Analytics to Google Sheets

What This Workflow Does

For marketing teams, business owners, and analysts, manually exporting data from Google Analytics and pasting it into spreadsheets is a repetitive, time-consuming chore. It's prone to errors, creates reporting delays, and takes valuable focus away from strategic analysis. This process often leads to outdated insights and fragmented data views across an organization.

This automation template solves that problem by creating a seamless bridge between Google Analytics and Google Sheets. It automatically extracts predefined metrics—like user sessions, pageviews, bounce rate, and conversion data—on a schedule you set, and populates a clean, organized spreadsheet. The result is a live, always-updated report that your entire team can access, eliminating manual work and ensuring data consistency.

How It Works

The workflow acts as an intelligent data pipeline, triggered by time or an event, to move information from point A to point B without any human intervention.

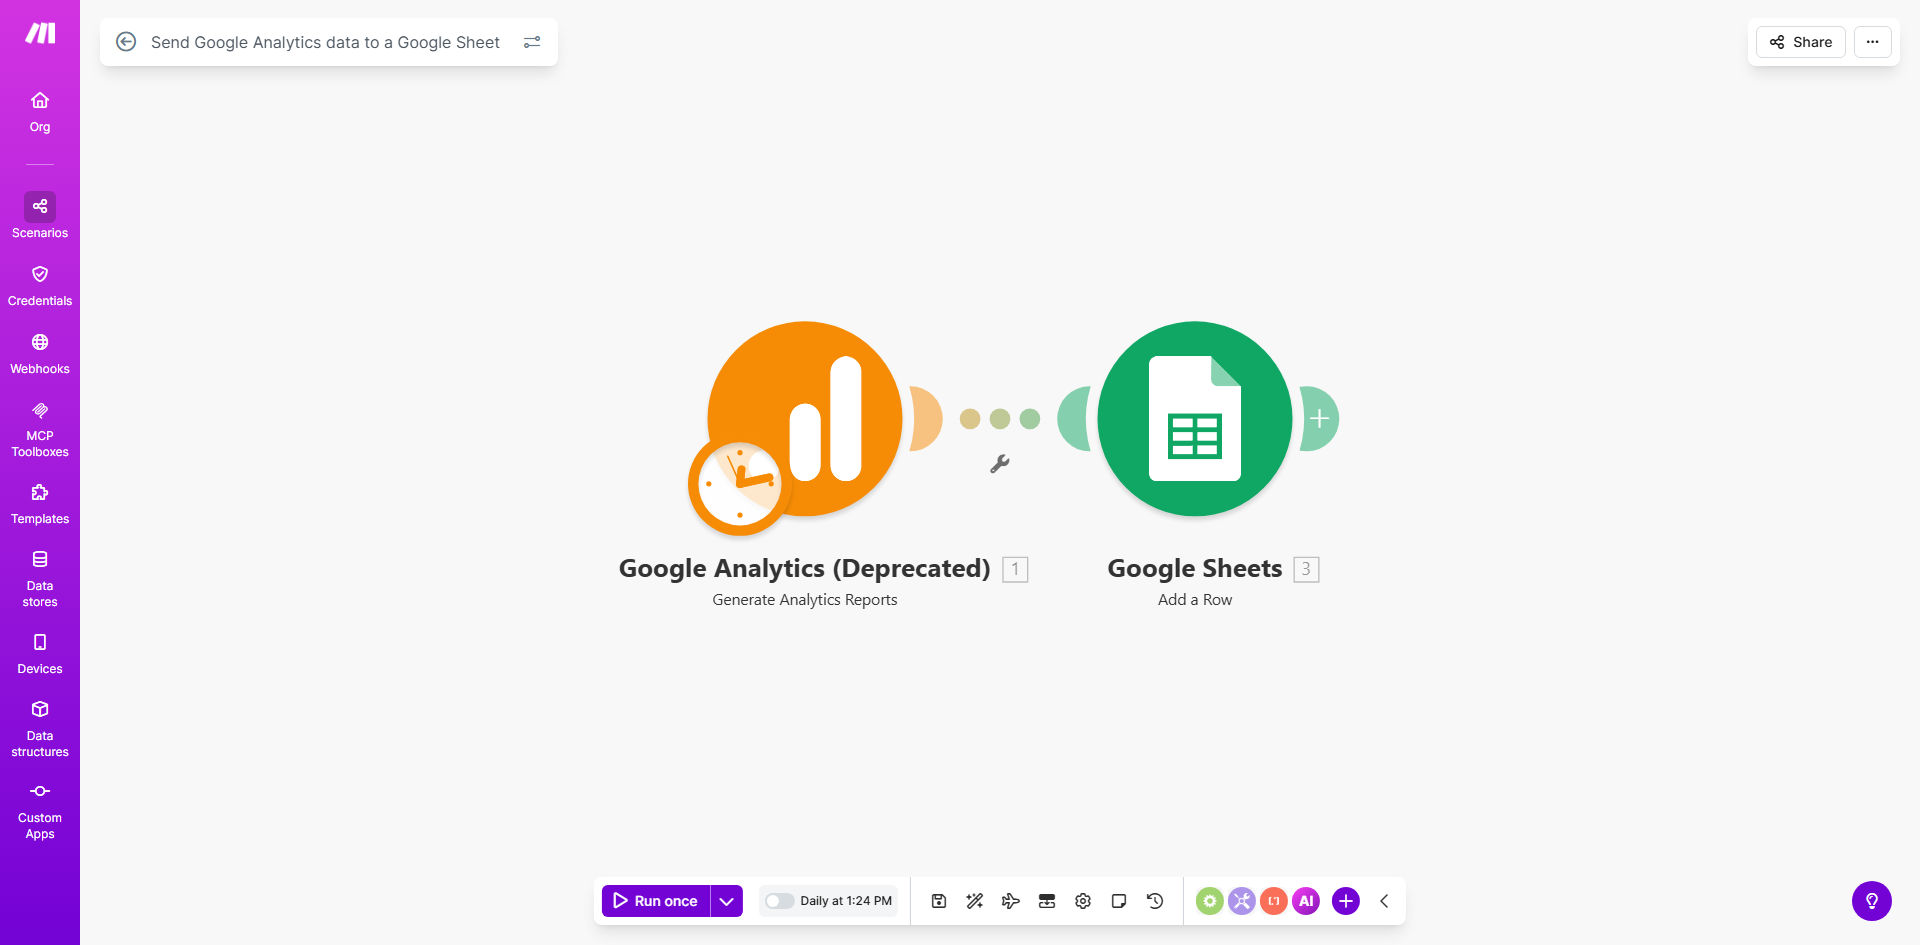
Step 1: Scheduled Trigger

The automation is initiated on a schedule you configure, such as every Monday morning or at the end of each month. This trigger ensures your reporting is consistent and timely without you having to remember to run it.

Step 2: Fetch Data from Google Analytics

The workflow connects to your Google Analytics account via a secure API. It requests the specific report data you've defined, such as performance metrics for a particular date range, property, or segment.

Step 3: Structure and Transform the Data

Raw API data is often nested and complex. The workflow parses this data, flattening it into a simple row-and-column structure that is perfect for a spreadsheet. It can also perform calculations, like deriving conversion rates from totals.

Step 4: Update the Google Sheet

Finally, the processed data is sent to your designated Google Sheet. It can append new rows to a log, update a specific summary sheet, or populate a dashboard tab. Your spreadsheet becomes a dynamic, auto-updating hub for your web analytics.

Pro tip: Start by automating a single, critical report—like weekly traffic by channel. Once that's running smoothly, you can expand the automation to include other metrics like goal completions or e-commerce data.

Who This Is For

This automation is a game-changer for digital marketers who need to report on campaign performance, small business owners who want to track website health without logging into Analytics daily, and agencies that manage reporting for multiple clients. It's also invaluable for data analysts who use Sheets as a staging area for further analysis or visualization in tools like Data Studio.

What You'll Need

  1. A Make.com account (free tier available).
  2. A Google Analytics property with data you want to report on.
  3. Editor-level access to a Google Sheets spreadsheet where the data will be sent.
  4. Basic knowledge of the key metrics you want to track (e.g., sessions, users, conversion rate).

Quick Setup Guide

  1. Get the Template: Click "Get This Workflow" to copy the template into your Make.com account.
  2. Connect Your Apps: In the Make.com scenario, click the Google Analytics and Google Sheets modules to authenticate and connect your accounts.
  3. Configure the Data Pull: Specify your Google Analytics View ID, the metrics (e.g., ga:sessions), and dimensions (e.g., ga:date) you want to retrieve.
  4. Set Your Target Sheet: Point the Google Sheets module to the exact spreadsheet and worksheet where the data should be added. Define the cell range or choose to add a new row.
  5. Set the Schedule: Configure the schedule module to run daily, weekly, or monthly based on your reporting needs.
  6. Test & Activate: Run a single test execution to ensure data flows correctly into your Sheet. Once verified, activate the scenario to let it run automatically.

Key Benefits

Save 5-10 hours per month on manual reporting. Reclaim the time spent on logging in, exporting CSV files, and reformatting data for stakeholders.

Eliminate human error in data transcription. Automated data transfer ensures 100% accuracy, removing typos and misaligned figures from your critical reports.

Enable real-time decision-making. With data flowing into Sheets automatically, your reports are always current, allowing you to spot trends and react to performance changes faster.

Create a single source of truth. Consolidate your analytics data into a shared, accessible Google Sheet, improving transparency and alignment across marketing, sales, and leadership teams.

Scale your reporting effortlessly. Once set up, the same automation can be duplicated to track additional metrics, different date ranges, or even multiple client accounts without extra work.

Frequently Asked Questions

Common questions about Google Analytics and Google Sheets automation and integration

Automating this process eliminates manual data entry, reduces human error, and frees up 5-10 hours per week for marketing teams. It ensures your reports are always up-to-date, allowing for real-time decision-making based on accurate, automatically compiled data.

Beyond saving time, it transforms reporting from a reactive task into a proactive strategic tool. For example, an e-commerce manager can have daily sales and traffic data waiting in a sheet every morning, ready for analysis without any manual effort.

You can automate the transfer of key metrics like sessions, users, pageviews, bounce rate, conversion rates, and revenue. You can also pull data segmented by channel, device, location, or specific campaigns, creating a comprehensive dashboard for performance analysis directly in Sheets.

The flexibility is significant. You're not limited to standard reports. You could automate a report showing landing page performance for the last 7 days or track goal completions by traffic source, tailoring the data extraction to your specific business questions.

The workflow can be scheduled to run daily, weekly, or monthly, depending on your reporting needs. This ensures your spreadsheet reflects the latest performance data automatically, without requiring any manual intervention to refresh or pull new reports.

For most businesses, a daily or weekly update is ideal. Daily updates are perfect for active campaigns, while weekly summaries are excellent for team meetings and performance reviews. The schedule is completely customizable within the automation.

No, platforms like Make.com provide visual, no-code connectors for both services. You simply authenticate your accounts and map the data fields you want to transfer. The process is straightforward and doesn't require any programming knowledge, making it accessible for marketers and business owners.

The template provided handles the complex API interactions for you. Your main task is telling it which metrics to get and where to put them, which is done through simple dropdown menus and field mappings in a visual interface.

Absolutely. Once your Analytics data is flowing into Sheets, you can easily integrate it with data from Facebook Ads, LinkedIn, your CRM, or email marketing platforms. This creates a unified marketing dashboard for a holistic view of your performance and ROI.

This is where automation becomes truly powerful. Imagine a single dashboard that shows website conversions from Google Analytics alongside the ad spend from Meta Ads and new leads from your CRM, all updated automatically. This 360-degree view is impossible with manual reporting.

Automated reporting provides consistent, error-free data, enables faster strategic decisions, and improves team productivity by removing repetitive tasks. It also enhances transparency with stakeholders through always-available, professional reports, and helps identify trends and opportunities more quickly.

From a financial perspective, it directly impacts the bottom line. Faster insights can lead to quicker optimization of underperforming campaigns, and the hours saved can be redirected towards high-value creative or strategic work, improving overall marketing efficiency and effectiveness.

Yes, GrowwStacks specializes in building custom automation systems. We can design a tailored workflow that pulls specific metrics, combines data from multiple Analytics properties or views, formats reports to your brand, and sends automated summaries to your team, perfectly fitting your unique business processes.

Our consultants work with you to understand your reporting goals, data sources, and audience. We then build, test, and deploy a robust automation that works seamlessly in the background. You get a dedicated solution without the complexity of managing it yourself.

  • Connect multiple data sources into one master report.
  • Automate distribution of reports via email or Slack.
  • Implement advanced data transformations and calculations.

Need a Custom Google Analytics Automation?

This free template is a starting point. Our team builds fully tailored automation systems for your specific business needs.