What This Workflow Does
Product and growth teams rely on Amplitude for deep user behavior insights, but often hit a wall when it's time to share that data. Manually exporting chart results for weekly reports, executive dashboards, or cross-functional analysis is a repetitive, time-consuming task that steals hours from strategic work. This process is also prone to errors, versioning issues, and delays, leaving stakeholders with outdated information.
This automation solves that by creating a seamless, scheduled pipeline between Amplitude and Google Sheets. It acts as a dedicated data assistant, checking your specified Amplitude charts at regular intervals—be it hourly, daily, or weekly—and appending the fresh results directly into a structured Google Sheets spreadsheet. The result is a single, always-up-to-date source of truth that your entire team can access, analyze, and build upon without ever logging into Amplitude.
How It Works
The workflow is built on Make.com and operates on a simple "watch, fetch, and record" principle.
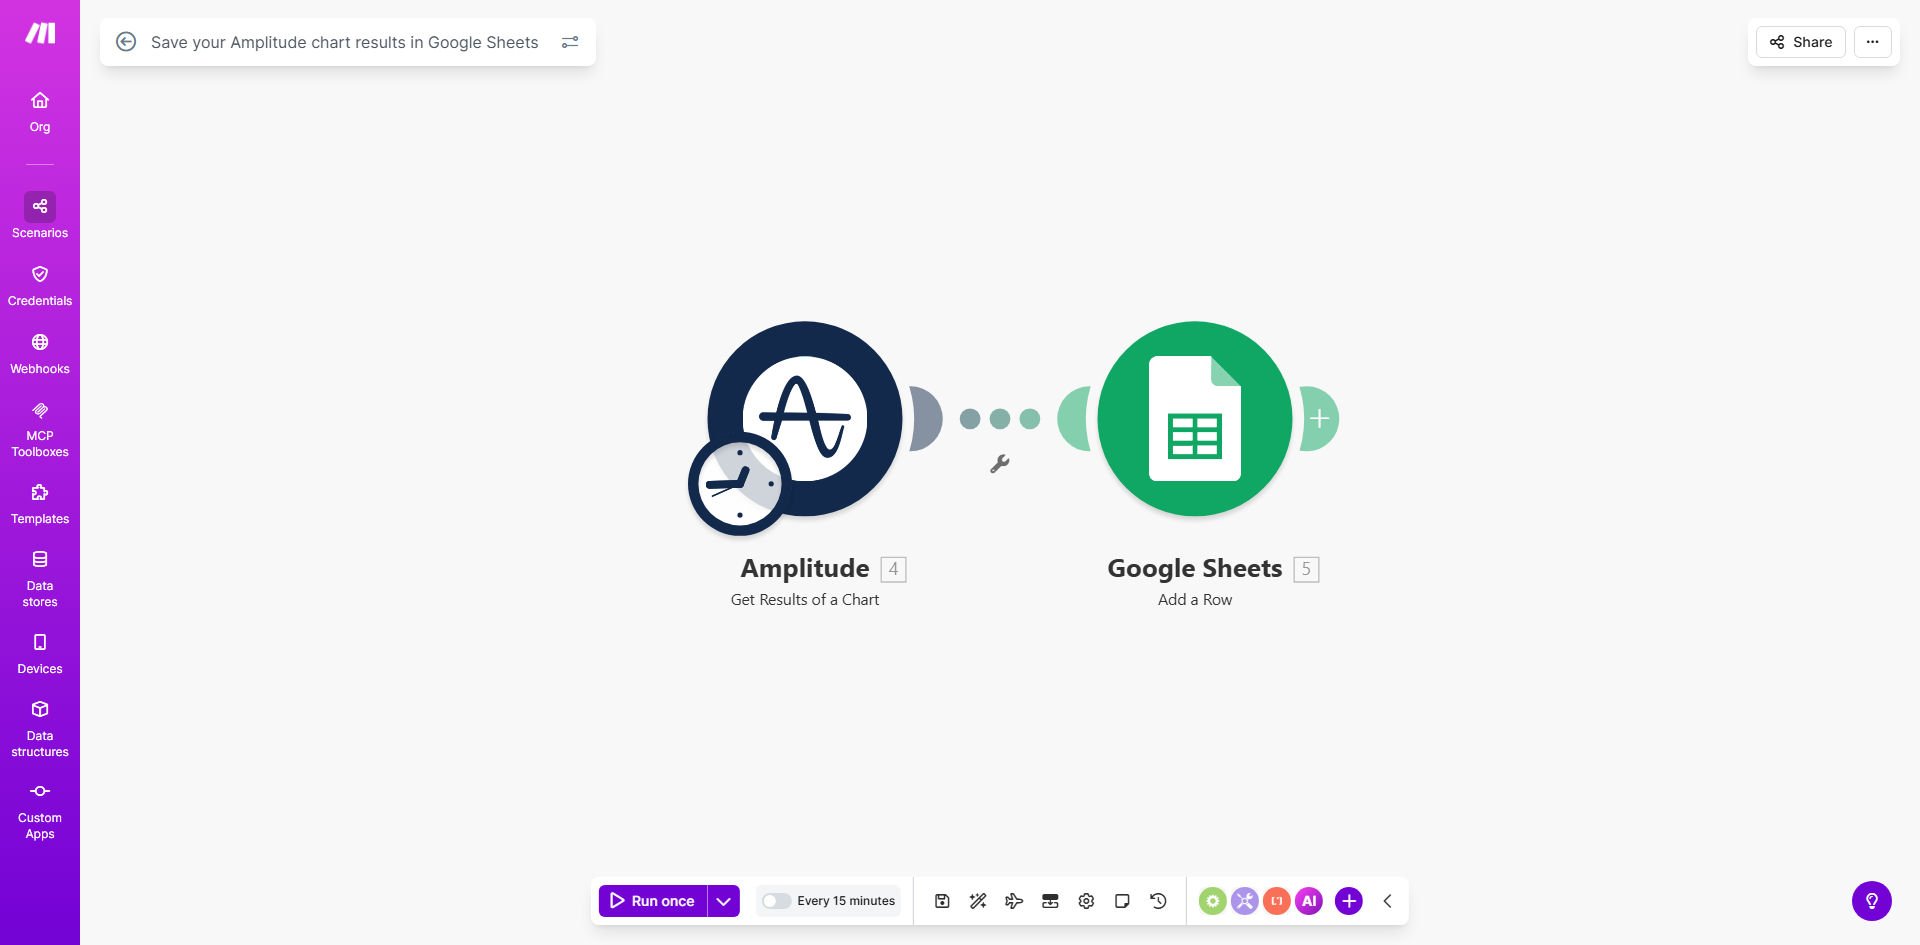
Step 1: Schedule the Trigger
The scenario starts with a Schedule module set to your desired interval. This could be every Monday morning for weekly performance reports, daily at 9 AM for team stand-ups, or even multiple times a day for real-time monitoring of critical metrics.
Step 2: Fetch Data from Amplitude
When triggered, the workflow authenticates with your Amplitude account via a secure API connection. It calls the specific chart or analysis you've configured, retrieves the latest dataset (including dimensions, metrics, and timestamps), and structures it for export.
Step 3: Format and Append to Google Sheets
The retrieved data is then mapped and sent to a pre-defined Google Sheets spreadsheet. The workflow can add a new row with each run, create a new tab for each period, or update a specific range, ensuring your historical data is preserved and organized chronologically.
Pro tip: Use a dedicated "Log" sheet within your master spreadsheet to track each automation run, including timestamps and any data summaries. This creates an audit trail and helps with debugging.
Who This Is For
This automation is a game-changer for any role that bridges product analytics and business operations. Product Managers can automate KPI reporting for stakeholders. Growth Marketers can track campaign impact on user behavior without manual exports. Data Analysts can create a reliable feed of Amplitude data for further modeling in Sheets or other tools. Founders and Executives gain access to a live dashboard of key metrics without needing analytics platform access.
What You'll Need
- A Make.com account (free tier is sufficient to start).
- An Amplitude account with API access and a saved chart you want to export.
- A Google Sheets spreadsheet set up with headers for the data you intend to capture.
- The API credentials (or OAuth access) for both Amplitude and Google Sheets to connect them to Make.com.
Quick Setup Guide
- Clone the Template: Click "Get This Workflow" and duplicate the template into your Make.com account.
- Connect Your Apps: In the Make.com scenario, authorize the connections to your Amplitude project and your Google Drive/Sheets account.
- Configure the Amplitude Module: Point the module to the exact Chart ID or analysis you want to export. You can find this in the Amplitude chart's URL or API settings.
- Map Your Google Sheets: Select your target spreadsheet and worksheet. Map the incoming Amplitude data fields (like 'date', 'metric', 'value') to the corresponding columns in your sheet.
- Set Your Schedule: Adjust the Schedule module to run at the frequency that matches your reporting needs (e.g., every Monday at 8 AM).
- Test and Activate: Run the scenario once to ensure data flows correctly into your sheet. Then, turn the scenario on—it will now run automatically.
Key Benefits
Save 3–5 hours per week per analyst. Eliminate the repetitive cycle of logging in, exporting CSVs, and reformatting data for reports. This time can be reinvested in actual analysis and strategy.
Ensure 100% data consistency and timeliness. Automated runs remove human error and guarantee that reports are generated on time, every time, with the latest available data.
Democratize data access across your organization. By centralizing key metrics in a familiar tool like Google Sheets, you empower non-technical stakeholders in sales, marketing, and finance to access insights without training.
Create a historical archive effortlessly. Every automated run appends new data, building a comprehensive, timestamped history of your metrics that is invaluable for tracking long-term trends and performing year-over-year comparisons.
Scale your reporting effortlessly. Once one chart is automated, replicating the process for additional charts or dashboards is simple, allowing you to scale your data infrastructure without scaling your manual workload.