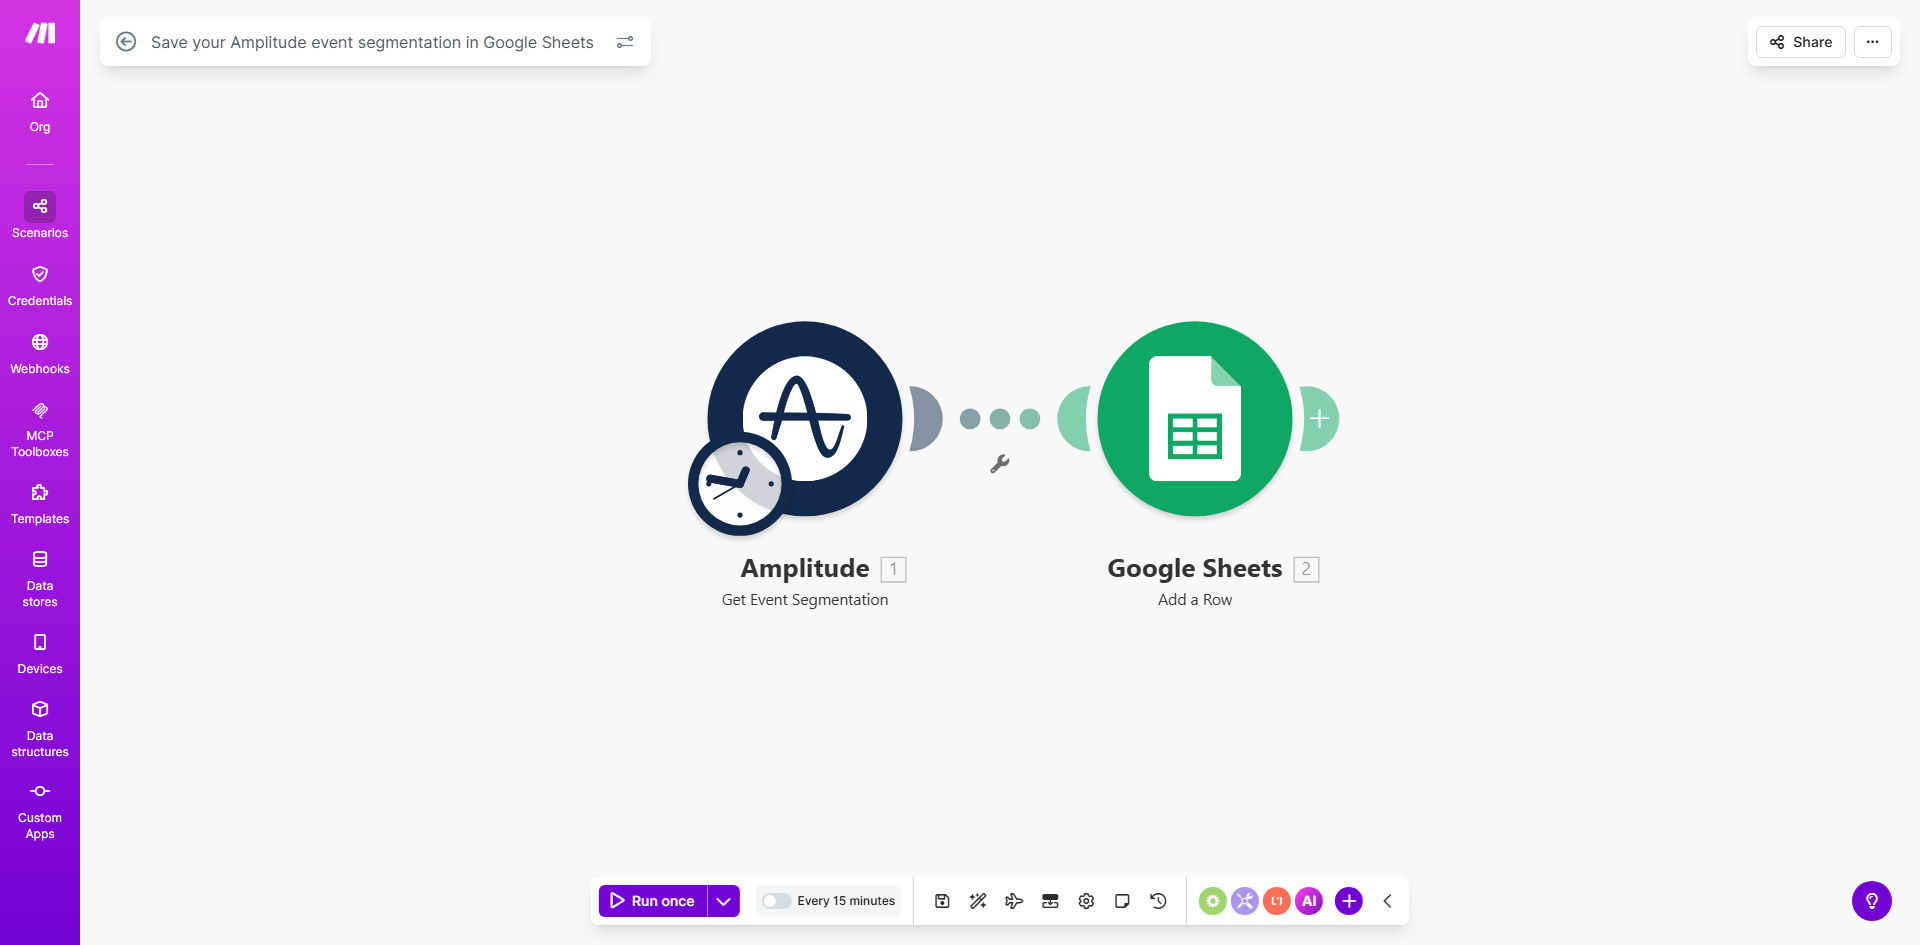
What This Workflow Does
Product and marketing teams rely on Amplitude to understand how users interact with their digital products. However, valuable segmentation data often gets trapped inside Amplitude, making it difficult to share with stakeholders, combine with other business metrics, or use for long-term trend analysis. Manually exporting CSV files is a repetitive, time-consuming task that leads to outdated reports and data silos.
This automated workflow solves that problem by connecting Amplitude directly to Google Sheets. It watches for your defined event segmentation—such as users who performed a specific action within a date range—and automatically sends that data to a specified spreadsheet at regular intervals. This creates a live, centralized data hub that your entire team can access, enabling better collaboration, more sophisticated analysis, and faster, data-driven decisions without any manual intervention.
How It Works
The workflow acts as a reliable bridge between your analytics platform and your collaborative reporting tool. Once set up, it runs silently in the background, ensuring your Sheets are always populated with the latest user insights.
Step 1: Schedule the Data Check
The scenario is triggered on a schedule you define—daily, weekly, or monthly. This timer module in Make.com initiates the process, ensuring your data exports happen consistently without you having to remember.
Step 2: Fetch Segmentation from Amplitude
Make.com then calls the Amplitude API using your credentials. It executes a pre-configured query to retrieve the specific event segmentation data you need, such as "Users who completed onboarding in the last 7 days" or "Users who made a purchase after viewing a feature."
Step 3: Transform and Structure the Data
The raw data from Amplitude is processed and mapped into a clean, tabular format. The workflow handles parsing JSON responses, extracting relevant user properties, and organizing the data into rows and columns suitable for a spreadsheet.
Step 4: Append to Google Sheets
Finally, the structured data is sent to your designated Google Sheets spreadsheet. It can append new rows to an existing sheet, create a new tab for each run, or update a specific range. This keeps a historical record and provides an always-up-to-date dataset for your team.
Pro tip: Use a new sheet tab for each weekly export. This preserves historical snapshots, making it easy to compare week-over-week or month-over-month trends directly within Google Sheets.
Who This Is For
This automation is ideal for any role that depends on Amplitude data but needs to use it outside the Amplitude platform. Product Managers can share feature adoption metrics with executives. Marketing Managers can export user cohorts for campaign targeting. Data Analysts can combine behavioral data with other business intelligence sources. Growth Teams can track experiment results over time. Essentially, if you find yourself repeatedly logging into Amplitude to download the same report, this workflow is for you.
What You'll Need
- A Make.com account (free tier is sufficient to start).
- An Amplitude account with API access and a specific event segmentation query you want to export.
- A Google Sheets spreadsheet set up and ready to receive data, with edit permissions granted to your Make.com connection.
- Your Amplitude API key and Secret Key for authentication within Make.com.
Quick Setup Guide
You can have this automation running in under 15 minutes. Follow these steps after cloning the template.
- Connect Your Apps: In the Make.com scenario, authorize the Amplitude and Google Sheets modules using your account credentials.
- Configure the Amplitude Query: Input the exact segmentation query from your Amplitude account. Define the events, user properties, and date range you want to capture.
- Set the Schedule: Choose how often you want the data to sync. A daily schedule is recommended for most active teams.
- Map Your Google Sheet: Specify the exact Google Sheets file ID and worksheet name where the data should be sent. Define the starting cell for appending new rows.
- Test and Activate: Run the scenario once manually to verify data flows correctly from Amplitude into your Sheet. Then turn on the scheduler to let it run automatically.
Key Benefits
Saves 5–10 hours per month per analyst by eliminating the manual process of logging in, creating reports, and downloading/uploading CSV files. This time can be reinvested in actual analysis and strategy.
Ensures 100% data accuracy and timeliness by removing the human error factor from repetitive exports. Your reports and dashboards are always based on the latest data, leading to more confident decision-making.
Democratizes data access across your organization by placing key Amplitude insights into a tool everyone knows—Google Sheets. Sales, support, and finance teams can now access user behavior data without needing Amplitude training.
Enables advanced, cross-functional analysis by allowing you to easily combine Amplitude data with other sources in Sheets, like revenue from Stripe or support tickets from Zendesk, uncovering insights that would be impossible in siloed tools.
Creates a reliable audit trail by maintaining a historical log of user segments over time directly in Sheets, which is invaluable for tracking long-term trends, proving the impact of product changes, and preparing for investor or board reviews.