What This Workflow Does
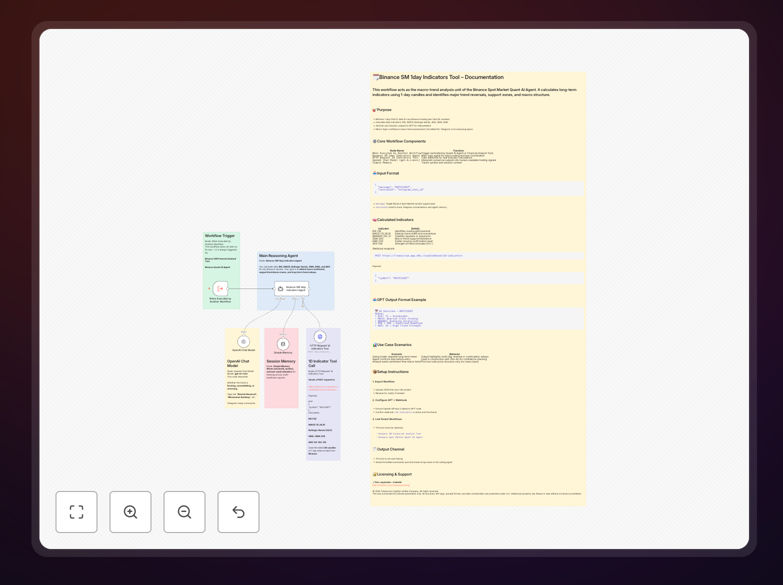
This n8n workflow provides professional traders with automated technical analysis of Binance Spot Market assets using 1-day candle data. It calculates essential indicators like RSI (Relative Strength Index) and MACD (Moving Average Convergence Divergence) to identify long-term trends and potential reversal points.
By automating these calculations, traders can save hours of manual chart analysis while ensuring consistent application of their technical analysis strategy. The workflow delivers structured data outputs that can trigger alerts, feed trading bots, or populate dashboards with actionable market insights.
How It Works
1. Binance API Data Fetching
The workflow connects to Binance's API to retrieve historical price data for specified trading pairs. It focuses on 1-day candles to analyze macro trends rather than short-term volatility.
2. Indicator Calculations
Key technical indicators are computed automatically: RSI measures momentum, MACD identifies trend direction and strength, while additional moving averages provide confirmation signals.
3. Signal Processing
The workflow evaluates indicator thresholds and crossover events to generate potential trade signals. These can be configured to match your specific trading strategy parameters.
4. Output Delivery
Results are formatted for integration with trading platforms, notification systems, or data visualization tools. Common outputs include CSV files, database entries, or API calls to execution platforms.
Who This Is For
This tool is designed for cryptocurrency traders and analysts who:
- Trade on Binance Spot Market with a technical analysis approach
- Prefer swing trading or position trading strategies (holding periods from days to weeks)
- Need consistent, automated indicator calculations across multiple trading pairs
- Want to integrate technical signals with other trading systems or alerts
Pro tip: Combine this workflow with price action analysis for higher-probability trade setups. The indicators provide context, but candlestick patterns often offer precise entry points.
What You'll Need
- Active Binance account with API keys (read-only permissions recommended)
- n8n instance (self-hosted or cloud version)
- Trading pairs list you want to analyze
- Destination for outputs (email, database, webhook, etc.)
Quick Setup Guide
- Download the JSON template file
- Import into your n8n instance
- Configure Binance API credentials in the HTTP Request nodes
- Set your preferred trading pairs in the initial trigger
- Adjust indicator parameters (periods, thresholds) if needed
- Connect output nodes to your notification or execution systems
- Test with historical data before going live
Key Benefits
Save 5-10 hours weekly by automating repetitive technical analysis tasks across multiple trading pairs.
Remove emotional bias with consistent, rules-based indicator calculations applied uniformly to all your watched assets.
Capture macro trends early through systematic scanning of 1-day charts, helping identify major moves before they become obvious on lower timeframes.
Integrate with existing systems by feeding signals into trading journals, execution bots, or portfolio management dashboards.