What This Workflow Does
This automation solution addresses the critical challenge of monitoring multiple systems and workflows for errors. Instead of checking individual dashboards or waiting for user reports, it actively monitors all connected systems, aggregates error events, and delivers prioritized notifications to your team via their preferred communication channels.
The system intelligently routes alerts based on severity levels - critical issues trigger immediate notifications with escalation paths, while lower-priority warnings are batched into periodic reports. This prevents alert fatigue while ensuring important issues aren't missed.
How It Works
1. Error Detection
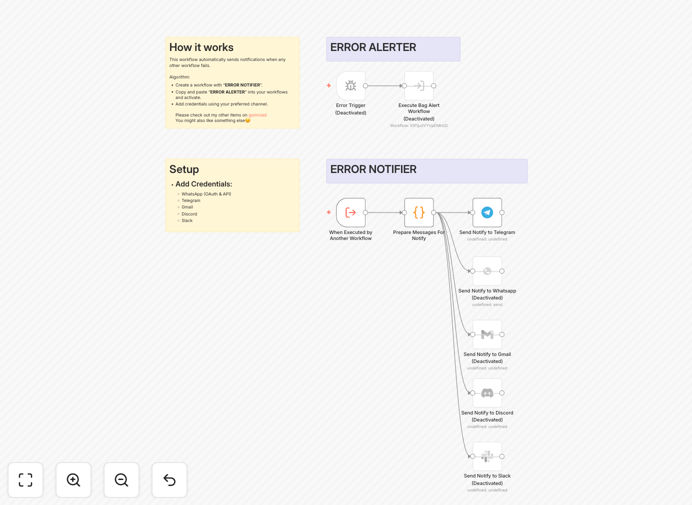
The workflow continuously monitors connected systems through API integrations, webhooks, and scheduled checks. It identifies error conditions based on predefined rules and thresholds.
2. Alert Aggregation
Related errors are grouped to prevent notification spam. The system analyzes patterns to distinguish between isolated incidents and systemic issues requiring immediate attention.
3. Intelligent Routing
Alerts are routed based on severity, time of day, and team responsibilities. Critical alerts bypass all filters to ensure immediate visibility.
Who This Is For
This solution is ideal for development teams running multiple automated workflows, DevOps engineers managing cloud infrastructure, and IT operations teams responsible for system uptime. It's particularly valuable for:
- Startups with limited staff needing 24/7 monitoring
- Distributed teams working across timezones
- Companies with complex, interconnected systems
- Organizations transitioning to automated operations
Pro tip: Combine this with incident management workflows to automatically create tickets in your helpdesk system when critical errors are detected.
What You'll Need
- Zapier account with admin access
- Telegram bot token or Slack webhook URL
- API access to systems you want to monitor
- List of critical error conditions to monitor
- Team notification preferences (channels, schedules)
Quick Setup Guide
- Download the template file and import into your Zapier account
- Configure your monitoring sources (APIs, webhooks, etc.)
- Set up your messaging platform integrations
- Define your alert severity rules and routing logic
- Test with simulated errors to verify notifications
- Deploy to production and monitor the alert dashboard
Key Benefits
Reduce downtime costs by catching issues before they impact users. Early detection of problems can prevent cascading failures that lead to extended outages.
Improve team productivity by eliminating manual monitoring tasks. Developers spend less time checking logs and more time building features.
Standardize incident response with consistent alert formats and escalation paths. All team members receive the same contextual information about issues.
Gain operational insights from aggregated error data. Identify recurring problems and systemic weaknesses in your architecture.