What This Workflow Does
This automation creates a complete MCP (Model Context Protocol) server that provides comprehensive API integration monitoring and testing capabilities. It solves the critical business problem of API reliability—when integrations between your CRM, marketing tools, databases, and other systems fail, it can disrupt operations, cause data loss, and impact customer experience.
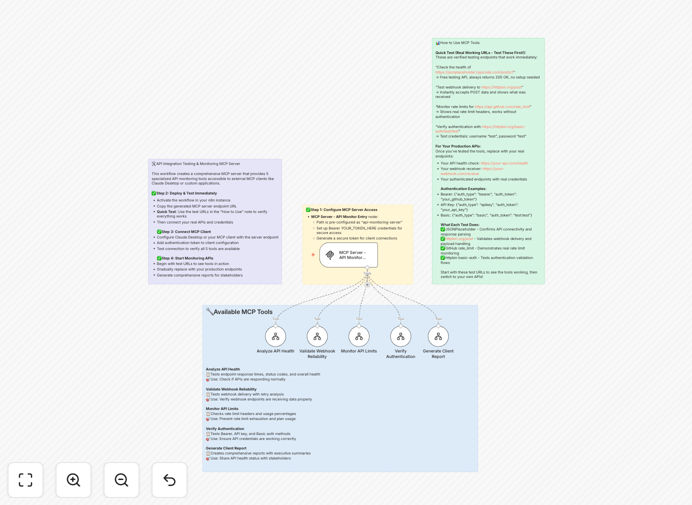
The server exposes five specialized tools through a single endpoint: API health analysis, webhook reliability testing, rate limit monitoring, authentication verification, and client report generation. External applications and AI assistants can connect to this MCP server to access all monitoring tools, making API status checking accessible to non-technical team members through natural language queries.
Instead of manually testing connections or waiting for customer complaints about sync issues, this workflow provides continuous, automated monitoring with instant alerts and detailed reporting. It's particularly valuable for businesses relying on multiple SaaS applications where data consistency across platforms is essential for sales, marketing, and operations.
How It Works
The workflow operates as a centralized monitoring hub that can be accessed by any MCP-compatible client, such as Claude Desktop or custom applications.
1. MCP Server Initialization
The workflow starts by creating an MCP server endpoint with secure bearer token authentication. This server acts as the gateway for all monitoring requests, ensuring only authorized clients can access your API status information.
2. API Health Analysis Tool
When requested, the server tests API endpoints for response time, status codes, and data format validity. It performs sequential requests to check connectivity, measures latency, and validates that responses match expected schemas—critical for ensuring data flows correctly between systems.
3. Webhook Reliability Testing
The system sends test payloads to webhook URLs and verifies delivery, response time, and data integrity. It simulates real events from your applications to ensure webhooks are properly configured and receiving data—preventing missed notifications or failed triggers in automated processes.
4. Rate Limit Monitoring
It tracks API usage against known rate limits, predicting when thresholds will be reached based on current consumption patterns. This prevents service disruptions by alerting teams before limits are exceeded, allowing for proactive quota management or workflow adjustments.
5. Authentication Verification
The workflow tests authentication tokens and credentials for validity, checking expiration dates and permission scopes. It identifies soon-to-expire tokens that could break integrations, enabling timely renewal before authentication failures occur.
6. Client Report Generation
All monitoring results are compiled into comprehensive reports with status summaries, trend analysis, and actionable recommendations. These reports can be scheduled or generated on-demand for stakeholder review, compliance documentation, or performance optimization planning.
Who This Is For
This template is designed for DevOps engineers, API developers, integration specialists, and technical teams responsible for maintaining API reliability and performance. It's particularly valuable for:
SaaS companies monitoring client integrations and webhook deliveries to ensure customer success and prevent churn due to technical issues.
E-commerce businesses that rely on multiple integrations between their store, CRM, inventory management, and shipping systems where data consistency is revenue-critical.
Marketing agencies managing client tech stacks with connections between advertising platforms, analytics tools, and CRM systems that must sync campaign data accurately.
Development teams implementing API monitoring strategies for internal applications or client projects who need comprehensive visibility without building custom dashboards from scratch.
IT operations teams responsible for business system reliability who need to monitor third-party API dependencies that could impact internal processes and employee productivity.
Pro tip: Start by monitoring your most revenue-critical integrations first—typically payment processors, CRM syncs, and order fulfillment APIs. These have the highest business impact when they fail.
What You'll Need
- MCP Client: Any MCP-compatible application (Claude Desktop, custom MCP client, or other AI tools) to connect to the monitoring server.
- Network Access: Outbound HTTP/HTTPS access from your n8n instance to test API endpoints and webhooks you want to monitor.
- Authentication Credentials: Valid API keys, tokens, or credentials for the systems you're monitoring (stored securely in n8n credentials).
- Target API Documentation: Endpoint URLs, expected response formats, rate limits, and authentication methods for each system you'll monitor.
- n8n Instance: Self-hosted n8n or n8n.cloud with ability to create webhook and HTTP request nodes (most plans support this).
Quick Setup Guide
Follow these steps to deploy this API monitoring solution in your environment:
- Download and Import: Download the template file and import it into your n8n instance via the workflow import function.
- Configure Authentication: Update the MCP Server node with your preferred authentication method and generate a secure bearer token for client access.
- Add API Details: For each tool (health, webhooks, etc.), add the specific endpoints, credentials, and test parameters for your systems.
- Test Connectivity: Activate the workflow and use your MCP client to connect to the server endpoint, testing each monitoring tool with sample requests.
- Set Up Alerts: Configure the conditional logic nodes to send notifications (email, Slack, etc.) when issues are detected based on your thresholds.
- Schedule Regular Checks: Add a schedule trigger or webhook to run monitoring at appropriate intervals—hourly for critical systems, daily for others.
Implementation note: Start with a small subset of critical APIs first. Once you've validated the monitoring works correctly, gradually add more systems to avoid configuration overload.
Key Benefits
Prevent revenue loss from API failures by detecting issues before they impact customers or business processes. A single payment processing failure during checkout or CRM sync issue during lead capture can cost thousands in lost opportunities.
Save 10-20 hours monthly that technical teams spend manually testing integrations, investigating sync issues, and generating status reports. This automation handles continuous monitoring with zero ongoing effort.
Improve customer experience by ensuring data consistency across all customer-facing systems. When your support, sales, and billing systems show synchronized information, customers get better service and fewer frustrations.
Reduce mean time to resolution (MTTR) for integration issues from hours to minutes with instant alerts and detailed diagnostics. The system tells you exactly what's broken and often why, speeding up fixes dramatically.
Enable non-technical team access to API status through natural language queries via MCP clients. Marketing managers can ask "Are our CRM webhooks working?" without needing dashboard access or technical assistance.