What This Workflow Does
Manual route planning for truck shipments is time-consuming, error-prone, and doesn't scale. Logistics teams often rely on rough estimates or manual lookups to calculate distances and travel times between cities, leading to inaccurate cost forecasts, inefficient fleet utilization, and missed delivery windows.
This n8n workflow automates the entire process. It connects directly to a Google Sheet containing your shipment lanes (with departure and destination coordinates), queries the OpenRouteService API using the truck-specific routing profile, and returns precise distance (in meters), travel time (in seconds), and route step details. The results are then written back to your spreadsheet, creating a live, accurate database for logistics planning.
How It Works
The automation follows a logical, step-by-step process to transform raw coordinates into actionable logistics data.
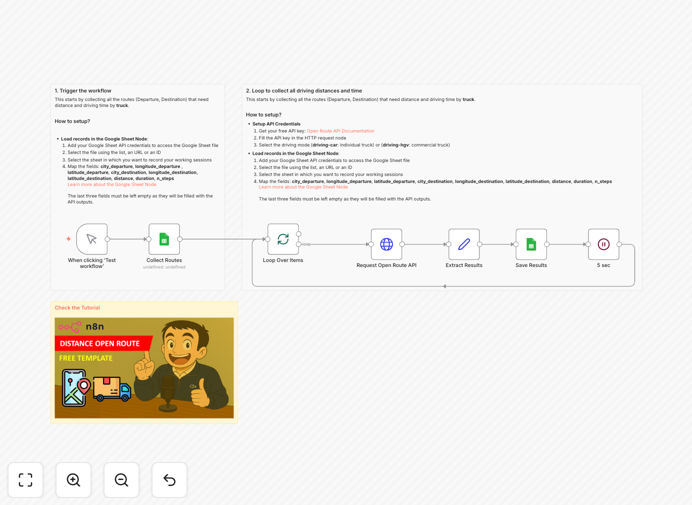
Step 1: Load Route Data
The workflow starts by reading your Google Sheet. Each row should contain pairs of coordinates (latitude/longitude) for origin and destination cities. This setup is ideal for maintaining a master list of common shipping lanes.
Step 2: Loop Through Each Record
n8n processes each row individually, ensuring every route pair is calculated accurately. This batch handling is perfect for weekly planning or updating a large lane database.
Step 3: Query OpenRouteService API
For each pair, an HTTP request is sent to the OpenRouteService API using the 'driving-hgv' (Heavy Goods Vehicle) profile. This is critical—truck routing accounts for restrictions, road types, and regulations that car routing ignores.
Step 4: Extract and Transform Results
The API returns a detailed route summary. The workflow extracts the total distance, total duration, and number of maneuvers. This data is cleaned and formatted for easy consumption.
Step 5: Update Your Spreadsheet
Finally, the calculated values are written back into new columns in the same Google Sheet. Your team now has an automated, up-to-date routing table.
Pro tip: Use this workflow as a foundation for a logistics control tower dashboard. The output can feed into cost-per-mile models, CO2 emission calculators, or driver scheduling systems.
Who This Is For
This template is designed for businesses and teams that manage transportation and need accurate, automated route data.
Logistics Managers & Dispatchers: Perfect for creating reliable cost estimates and planning efficient truck routes without manual map searches.
Supply Chain Analysts: Use the output data for network optimization studies, warehouse location analysis, and transportation cost modeling.
Freight Brokers & 3PLs: Quickly generate accurate quotes for customers based on real distance and time, improving professionalism and win rates.
Sustainability Teams: Accurate distance data is the first step in calculating and reporting on transportation-related carbon emissions.
What You'll Need
- A Google Sheet with at least four columns: Origin Latitude, Origin Longitude, Destination Latitude, Destination Longitude.
- A free OpenRouteService API key (sign up at openrouteservice.org). The free tier offers ample requests for typical logistics planning.
- An n8n instance (cloud or self-hosted) to import and run the workflow.
- Basic familiarity with connecting n8n to Google Sheets (via OAuth) is helpful but not required—follow the sticky notes in the template.
Quick Setup Guide
You can have this automation running in under 15 minutes.
- Download the template using the button above and import it into your n8n workspace.
- Set up the Google Sheets connection. Use the OAuth credentials in n8n to grant access to your spreadsheet. Update the 'Sheet ID' and range in the first node.
- Add your OpenRouteService API key. Paste your free key into the HTTP Request node's authentication field.
- Test with a single row. Execute the workflow once to ensure data flows correctly from Sheets → API → back to Sheets.
- Schedule or trigger it. Set the workflow to run on a schedule (e.g., weekly) or trigger it manually when your lane list updates.
Pro tip: Before running on your full dataset, test with 2-3 known city pairs to validate the accuracy of the returned distances and times against Google Maps or your existing records.
Key Benefits
Eliminate Manual Errors: Replace prone-to-error manual lookups with consistent, automated API calls. This ensures every calculation uses the same logic and data source.
Scale Your Planning: Calculate hundreds of routes in minutes, not days. This scalability is essential for growing businesses or complex network analyses.
Improve Cost Accuracy: Precise distance and time data leads to more accurate fuel cost forecasts, driver wage calculations, and customer pricing.
Enhance Operational Agility: With an automated system, you can quickly model "what-if" scenarios, like adding a new warehouse or servicing a new region.
Build a Data Foundation: The output creates a clean, historical dataset for analyzing trends, benchmarking performance, and reporting on logistics KPIs.