n8n Analytics Email Reports

Generate Weekly Workflow Analytics Reports with n8n API & Email Delivery

Automatically track and report on all your n8n workflow executions. Get weekly performance summaries delivered to your inbox with key metrics, error rates, and execution trends.

Download Template JSON · Zapier compatible · Free
Screenshot of n8n workflow analytics report in email format

What This Workflow Does

This automation solves the problem of manual workflow monitoring by automatically generating comprehensive analytics reports from your n8n instance. Instead of checking individual executions or building custom dashboards, you'll receive a weekly email summary with all key metrics, error analysis, and performance trends.

The report helps technical teams identify problematic workflows before they cause major issues, while giving managers visibility into automation ROI. By centralizing this data in an easy-to-digest format, teams can make data-driven decisions about workflow optimization and resource allocation.

How It Works

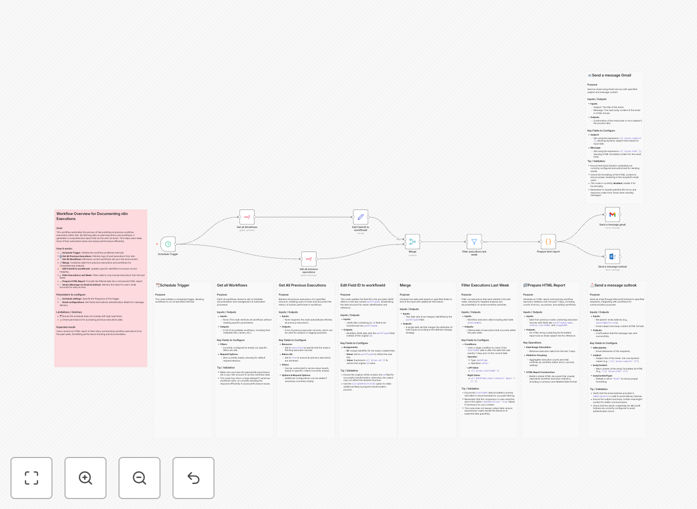
1. Scheduled Data Collection

Every week, the workflow queries n8n's API to gather execution data for all your workflows. It pulls metrics like success rates, execution times, and error messages from the specified date range.

2. Data Processing

The raw data is transformed into meaningful metrics and visualizations. The system calculates trends, compares week-over-week performance, and flags any anomalies or degradation in workflow reliability.

3. Report Generation

A formatted HTML email is created with tables and charts showing the most important metrics. The report highlights top-performing workflows, frequent errors, and recommendations for optimization.

Who This Is For

This automation is ideal for:

  • n8n administrators who need to monitor workflow health
  • Operations teams tracking automation performance
  • Technical leaders who want visibility into workflow ROI
  • Developers troubleshooting problematic workflows

Pro tip: Use the report's error analysis section to prioritize debugging efforts. The most frequent errors often represent the biggest opportunities for workflow improvement.

What You'll Need

  1. An n8n instance with workflows already running
  2. API access to your n8n server
  3. An email service configured in your automation platform
  4. Basic understanding of n8n's execution data structure

Quick Setup Guide

  1. Download the template JSON file
  2. Import it into your n8n or Zapier instance
  3. Configure the n8n API connection with your credentials
  4. Set the recipient email address(es) for reports
  5. Adjust the schedule to match your preferred reporting cadence
  6. Test with a manual trigger to verify the output

Key Benefits

Proactive issue detection: Catch workflow problems before they impact business operations by monitoring error rates and performance trends.

Time savings: Eliminate manual data gathering and report generation that typically takes hours each week.

Performance optimization: Identify workflows that consume disproportionate resources or have declining success rates.

Stakeholder visibility: Share automated reports with non-technical team members to demonstrate automation value.

Frequently Asked Questions

Common questions about n8n workflow analytics and automation

Tracking n8n workflow analytics helps identify performance bottlenecks, error patterns, and optimization opportunities. Weekly reports provide visibility into automation health without manual monitoring, saving hours of analysis time while ensuring reliable operations.

For example, a marketing team discovered their lead processing workflow was failing 23% of the time during peak hours. The weekly report highlighted this trend, allowing them to optimize resource allocation and reduce failures to under 2%.

  • Identifies workflows needing optimization
  • Provides data for capacity planning
  • Reduces troubleshooting time

The reports include execution counts, success/failure rates, average duration, error types, and trend comparisons. You'll see which workflows consume the most resources and which ones need optimization, helping prioritize improvements.

A SaaS company uses these metrics to calculate their automation ROI, showing how much developer time was saved by successful workflows versus time spent fixing failed ones.

  • Execution volume by workflow
  • Success/failure percentages
  • Average processing time

Instead of manually compiling data from multiple sources, this automation aggregates all metrics automatically. What typically takes 2-3 hours weekly becomes a zero-effort process that delivers insights directly to your inbox.

One operations manager reported saving 15 hours monthly by eliminating manual report generation, allowing more time for actual workflow improvements based on the data.

  • Eliminates manual data collection
  • Standardizes reporting format
  • Provides consistent historical data

Yes, the template is fully customizable. You can add custom metrics, change visualization formats, or include additional context about specific workflows to match your team's reporting needs.

A financial services team added compliance-specific metrics to their reports, tracking data validation success rates and audit trail completeness for regulated workflows.

  • Add department-specific KPIs
  • Include workflow-specific notes
  • Modify visualization styles

The system uses n8n's secure API authentication and delivers reports only to authorized email addresses. All data remains within your n8n instance until the final report is generated and sent.

For enhanced security, some organizations configure the system to redact sensitive data from the reports while still preserving the key metrics needed for analysis.

  • Uses standard API authentication
  • Controlled email distribution
  • Option to redact sensitive data

The template can be easily modified for daily or monthly reporting. Simply adjust the schedule trigger and modify the date ranges in the API queries to match your preferred reporting cadence.

An e-commerce team runs daily reports during peak seasons to monitor high-volume order processing workflows, then switches back to weekly during slower periods.

  • Adjust schedule frequency
  • Modify date range parameters
  • Set different cadences for different workflows

Absolutely! GrowwStacks specializes in building tailored automation solutions. We can create custom analytics dashboards, integrate additional data sources, or build alert systems based on your specific workflow metrics.

Our team has built specialized analytics systems for clients ranging from simple enhanced reporting to complex predictive maintenance systems that forecast workflow failures before they occur.

  • Custom metric tracking
  • Advanced alerting systems
  • Integration with other analytics tools

Need a Custom n8n Analytics Solution?

This free template is a starting point. Our team builds fully tailored automation systems for your specific needs.