What This Workflow Does
As your n8n automation ecosystem grows, managing workflows individually becomes time-consuming and error-prone. The default n8n interface shows you one workflow at a time, but gives you no aggregated view of your entire instance's health, activity, and structure.
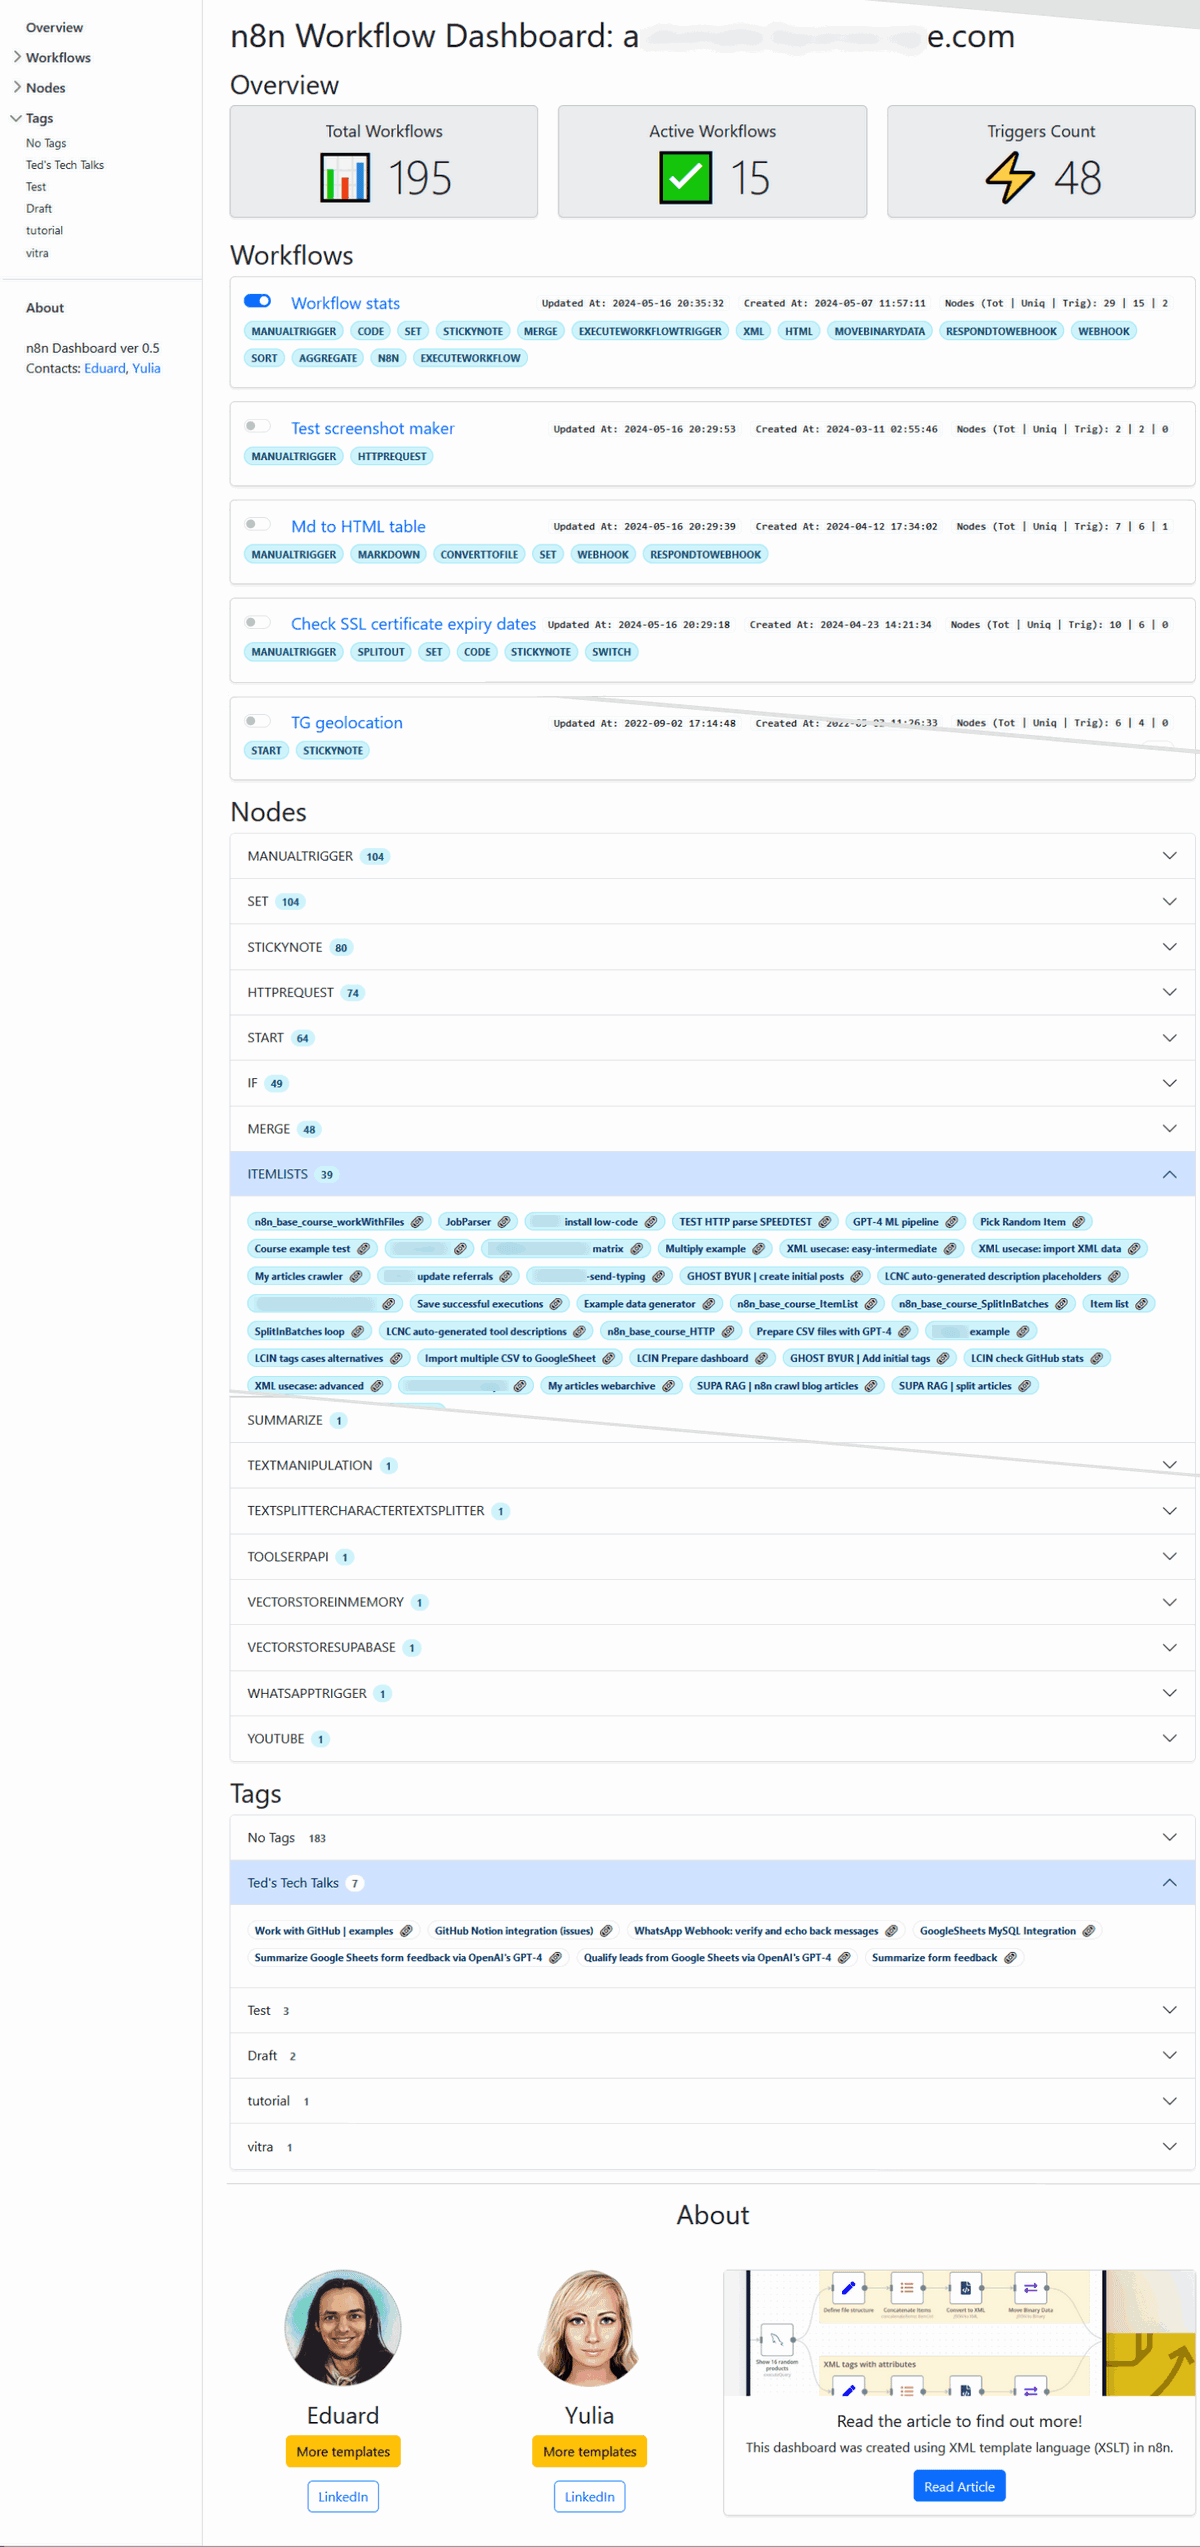
This workflow dashboard template solves that problem by generating a comprehensive, bird's-eye view of your entire n8n instance. It automatically collects data from all your workflows, analyzes node usage, organizes workflows by tags, lists all webhook endpoints, and presents everything in a clean, navigable HTML dashboard. You get instant visibility without manual investigation.
The dashboard is self-contained, built with XML stylesheets and Bootstrap 5, and generates structured JSON that can feed into other BI tools. It's particularly valuable for DevOps teams, IT managers, and automation leads who need to maintain oversight of complex n8n deployments.
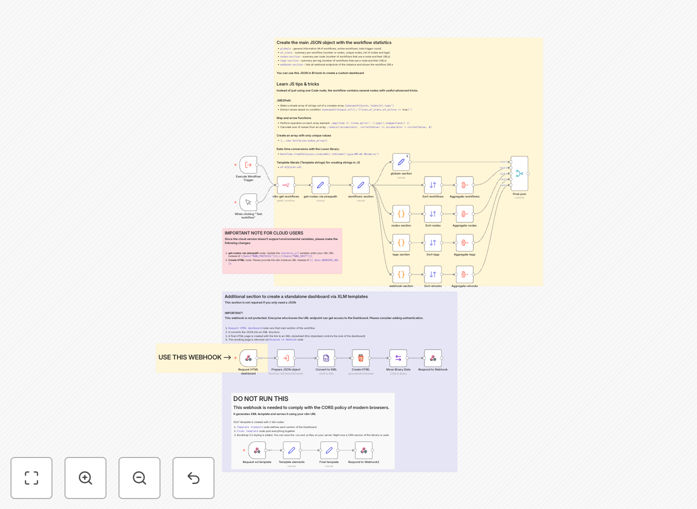
How It Works
The workflow connects to your n8n instance via its API, extracts metadata from all workflows, processes the data, and generates an HTML dashboard with several key sections.
1. Data Collection & API Integration
The workflow starts by authenticating with your n8n instance and fetching complete workflow data. It uses the n8n API to retrieve workflow definitions, node configurations, tags, and activation status.
2. Workflow Analysis & Aggregation
It processes each workflow to count nodes, identify triggers, extract timestamps, and categorize by tags. The system aggregates this data to show totals, active/inactive counts, and workflow distribution.
3. Node Frequency Analysis
The template analyzes which nodes are used most frequently across all workflows, helping you identify common patterns, potential bottlenecks, and opportunities for standardization.
4. Webhook Endpoint Compilation
It scans all workflows to identify and list every webhook endpoint, including their URLs and linked workflows. This is crucial for security audits and endpoint management.
5. Dashboard Generation
Using XML stylesheets and Bootstrap 5, the workflow generates a responsive HTML dashboard with a left-side navigation panel, summary cards, detailed tables, and interactive elements.
6. JSON Data Export
Alongside the HTML dashboard, the workflow produces structured JSON containing all analyzed data, ready for integration with external BI tools or custom reporting systems.
Who This Is For
This template is designed for businesses and teams that rely heavily on n8n for automation and need better operational visibility.
DevOps & IT Teams: Teams responsible for maintaining n8n instance health, performance, and security will benefit from centralized monitoring and alerting capabilities.
Automation Managers: Leaders overseeing multiple automation workflows across departments can use this dashboard to track adoption, usage patterns, and ROI.
Growing Startups: Companies scaling their automation efforts need tools to manage complexity before it becomes unmanageable.
Agencies & Consultants: Professionals managing n8n instances for multiple clients can standardize monitoring and reporting across all accounts.
Pro tip: Schedule this workflow to run daily or weekly and save the dashboard as a static file accessible to your team via internal web server. This creates an always-updated automation portal.
What You'll Need
- An n8n instance (self-hosted or cloud) with API access enabled.
- API credentials with permissions to read workflow data from your n8n instance.
- Basic n8n knowledge to import and configure the template.
- Optional: A web server or shared location to host the generated dashboard for team access.
- Optional: BI tools (Power BI, Tableau, etc.) if you want to integrate the JSON data into existing reporting.
Quick Setup Guide
Follow these steps to implement the dashboard in your n8n environment:
- Download and import the template JSON file into your n8n instance.
- Configure API connection by updating the "get-nodes-via-jmespath" node with your n8n instance URL and authentication details.
- Set environment variables for your n8n host, protocol, and webhook URL (cloud users: enter URLs directly in the nodes).
- Test the workflow manually to ensure it can access and process your workflow data correctly.
- Schedule execution using n8n's scheduler trigger to run at your desired frequency (daily recommended).
- Deploy the output by saving the generated HTML to a web-accessible location or integrating the JSON with your BI tools.
Key Benefits
Complete operational visibility in minutes, not hours. Instead of manually checking dozens of workflows, get an instant overview of your entire n8n ecosystem with actionable insights and metrics.
Identify optimization opportunities automatically. The node frequency analysis reveals which integrations you use most, helping you standardize approaches and reduce maintenance overhead.
Enhanced security through webhook transparency. The comprehensive webhook endpoint listing helps with security audits, endpoint management, and ensuring no unauthorized webhooks exist.
Scalable monitoring that grows with your automation. As you add more workflows, the dashboard automatically includes them without additional configuration or manual updates.
BI-ready data for executive reporting. The structured JSON output integrates seamlessly with business intelligence platforms, allowing you to combine automation metrics with other business data.