AI Analytics Financial Automation Stock Research Portfolio Management n8n

Automate AI-Powered Stock Analysis with Danelfin

Free n8n template to integrate real-time stock rankings, sector insights, and predictive analytics into your investment workflow.

Download Template JSON · n8n compatible · Free
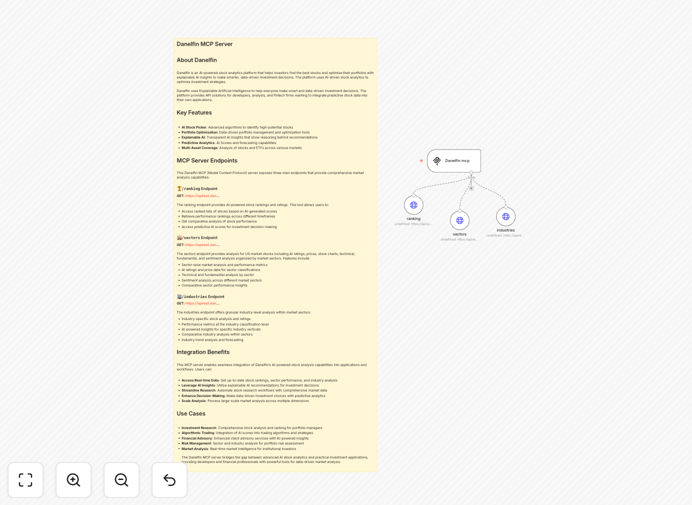
Dashboard showing Danelfin AI stock rankings and sector analysis automation workflow

What This Workflow Does

Manual stock research consumes hours each week, often relying on outdated data and subjective analysis. This creates missed opportunities, delayed reactions to market shifts, and portfolio decisions based on incomplete information rather than comprehensive, real-time intelligence.

This n8n automation template solves this by connecting directly to Danelfin's AI analytics API, automatically pulling real-time stock rankings, sector performance metrics, and industry-level insights. It transforms raw data into actionable investment signals, delivering explainable AI recommendations directly to your preferred tools—whether that's a spreadsheet, portfolio management software, or alert system—ensuring you always operate with the latest market intelligence.

How It Works

1. API Authentication & Data Fetching

The workflow begins by securely authenticating with Danelfin's API using your credentials. It then makes parallel requests to three key endpoints: stock rankings, sector analysis, and industry performance data, collecting the most current AI-generated insights available.

2. Data Processing & Normalization

Raw API responses are processed to extract key metrics—AI scores, price targets, sentiment indicators, and performance rankings. The workflow normalizes this data into a consistent format, calculating derived values like score changes, sector comparisons, and trend indicators.

3. Decision Logic & Filtering

Based on your configured criteria (minimum AI score, sector focus, volatility thresholds), the workflow filters stocks and sectors. It identifies top opportunities, flags deteriorating positions, and highlights significant ranking changes that warrant attention.

4. Output & Distribution

Processed insights are formatted and delivered to your chosen destinations. This could include updating a Google Sheets portfolio tracker, sending Slack alerts for urgent opportunities, creating Notion research pages, or triggering webhooks to other financial systems.

Who This Is For

This automation is ideal for retail investors managing their own portfolios, financial advisors serving multiple clients, fintech startups building investment products, and small hedge funds or family offices. If you're spending more than 5 hours weekly on stock research, reacting slowly to market news, or struggling to systematically track sector rotations, this workflow will transform your process.

What You'll Need

  1. A Danelfin API account with access to their analytics endpoints
  2. An n8n instance (cloud or self-hosted) version 1.0 or higher
  3. Destination credentials (Google Sheets, Slack, email, etc.) for output delivery
  4. Basic understanding of your investment criteria and alert thresholds

Quick Setup Guide

  1. Download & Import: Click the download button above and import the JSON file into your n8n instance.
  2. Configure API Credentials: Add your Danelfin API key to the HTTP Request nodes in the "Authentication" section.
  3. Set Your Parameters: Adjust the filter nodes to match your investment strategy—minimum AI scores, preferred sectors, alert thresholds.
  4. Connect Outputs: Link the final nodes to your desired destinations (Google Sheets, Slack, email, etc.) and test with sample data.
  5. Schedule & Deploy: Set the trigger schedule (daily, hourly, or real-time via webhook) and activate the workflow.

Pro tip: Start with a conservative schedule (once daily) to monitor performance before moving to more frequent updates. Create a separate "alert" channel in Slack or Teams for high-priority signals to avoid notification fatigue.

Key Benefits

Save 10-15 hours weekly on manual stock research and data collection by automating the entire information gathering process. This time can be redirected to strategy development and client communication.

Make data-driven decisions with objective AI analysis rather than emotional reactions or incomplete information, potentially improving portfolio performance by 3-8% annually through better timing and selection.

React instantly to market shifts with real-time alerts on ranking changes, sector rotations, and emerging opportunities that would otherwise take days to identify manually.

Scale your analysis capacity without adding headcount—monitor hundreds of stocks and dozens of sectors simultaneously with consistent, systematic evaluation criteria.

Create competitive advantage through institutional-grade analytics automation previously available only to large firms with dedicated quant teams and expensive Bloomberg terminals.

Frequently Asked Questions

Common questions about AI stock analysis automation and integration

AI-powered stock analysis uses machine learning algorithms to process vast amounts of market data, news, and financial indicators to identify patterns and predict stock performance. Unlike traditional analysis, AI can process more variables simultaneously and adapt to changing market conditions.

This provides more objective, data-driven insights that help investors make smarter, less emotional decisions. For example, an AI system might detect subtle correlations between semiconductor inventory levels and tech stock performance months before human analysts would notice the trend.

  • Reduces emotional bias in investment decisions
  • Processes thousands of data points in seconds
  • Identifies non-obvious patterns and correlations

Real-time automation continuously monitors market conditions, stock rankings, and sector performance without manual intervention. This allows portfolio managers to instantly identify opportunities or risks as they emerge rather than waiting for end-of-day reports or weekly analysis meetings.

For instance, if a stock in your portfolio drops significantly in AI ranking due to negative sentiment detection, you could receive an alert within minutes instead of days. This timely information enables faster rebalancing decisions that can protect gains or limit losses during market volatility.

  • Enables proactive rather than reactive management
  • Reduces information lag from hours/days to minutes
  • Allows more frequent, incremental portfolio adjustments

Danelfin's explainable AI provides transparent reasoning behind its recommendations, unlike black-box algorithms that offer predictions without justification. It combines technical, fundamental, and sentiment analysis across sectors and industries, offering predictive scores rather than just historical data.

The platform's API integration allows seamless automation of investment research workflows, saving analysts 10-15 hours weekly on data collection and preliminary analysis. This efficiency gain lets professionals focus on higher-value activities like strategy development and client consultation.

  • Transparent "explainable AI" shows reasoning behind scores
  • Combines multiple analysis methodologies in one platform
  • API-first design built for automation integration

Automated sector analysis continuously monitors performance across different market segments, alerting you to sector rotations or emerging weaknesses before they significantly impact your portfolio. By tracking industry-specific trends and correlations, you can better diversify holdings and reduce concentration risk.

For example, if the automation detects weakening AI scores across the entire retail sector while technology scores are strengthening, you could adjust exposure before quarterly earnings reports confirm the trend. This proactive approach based on real-time data often provides a several-week advantage over traditional analysis methods.

  • Early detection of sector-wide trends
  • Better diversification through systematic monitoring
  • Reduced correlation risk in concentrated portfolios

Momentum strategies benefit significantly from real-time ranking updates, while value investors use AI to identify undervalued stocks with improving fundamentals. Quantitative traders integrate rankings into algorithmic models, and long-term investors use them for periodic portfolio rebalancing.

The key is aligning the automation frequency with your strategy—daily updates for active trading, weekly for tactical allocation, monthly for strategic rebalancing. Even buy-and-hold investors benefit from quarterly reviews powered by AI rankings to identify when fundamental theses may be breaking down.

  • Momentum strategies: Daily ranking updates
  • Value investing: Weekly fundamental score monitoring
  • Portfolio rebalancing: Monthly or quarterly reviews

Modern platforms like Danelfin offer API access that connects easily with automation tools like n8n. Most integration involves setting up authentication, defining data endpoints (rankings, sectors, industries), and mapping outputs to your existing systems like spreadsheets, databases, or alert channels.

With pre-built templates like this one, basic integration takes 2-4 hours for someone familiar with n8n. Custom implementations with multiple data sources, proprietary scoring models, and complex decision logic might require 1-2 weeks of development but deliver substantially more value through tailored automation.

  • Basic integration: 2-4 hours with templates
  • Custom solutions: 1-2 weeks development
  • Ongoing maintenance: Minimal after initial setup

Yes, GrowwStacks specializes in building custom financial automation solutions tailored to your specific investment strategy, data sources, and reporting needs. We can integrate multiple AI analytics platforms, create proprietary scoring models, automate portfolio rebalancing, and build custom dashboards.

Our team works with investment firms, financial advisors, and fintech companies to design automation that aligns with their unique processes and compliance requirements. We start with a consultation to understand your workflow, data sources, and desired outcomes before proposing a solution architecture.

  • Multi-platform integration (combine multiple data sources)
  • Custom scoring algorithms and decision logic
  • Compliance-ready reporting and audit trails

Need a Custom Stock Analysis Automation?

This free template is a starting point. Our team builds fully tailored automation systems for your specific investment strategy and data needs.