What This Workflow Does
This n8n workflow automates industrial incident reporting for factory operations. It continuously monitors sensor data from manufacturing equipment, logs all readings in a CrateDB database for historical analysis, and automatically creates PagerDuty incidents when temperature thresholds are exceeded.
The system eliminates manual monitoring of factory equipment, reducing response time from hours to seconds. When a machine's temperature crosses the safety threshold (typically 50°C), the workflow immediately generates an incident report in PagerDuty, notifies the responsible maintenance team, and creates a complete audit trail in the database. This ensures equipment failures are addressed before they cause production downtime or safety hazards.
Beyond basic alerting, the workflow converts temperature readings between Celsius and Fahrenheit, provides contextual data about the affected machine, and maintains comprehensive logs for compliance and trend analysis. It's designed specifically for manufacturing environments where equipment reliability directly impacts productivity and safety.
How It Works
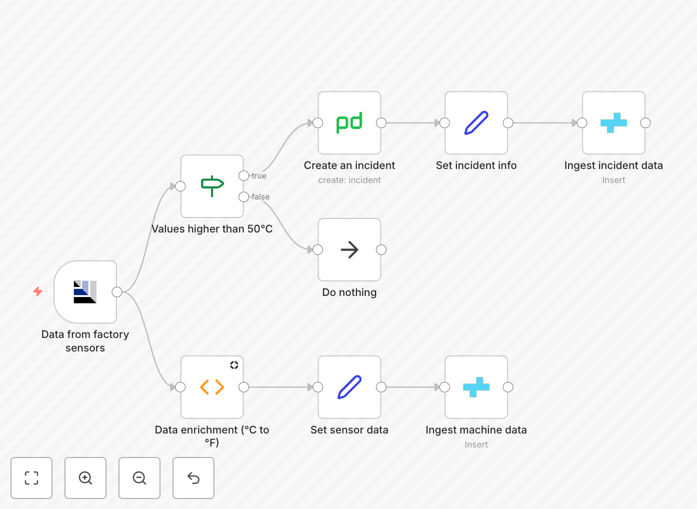
The automation follows a logical sequence to detect, process, and respond to equipment anomalies in real-time.
Step 1: Sensor Data Collection
The workflow begins with an AMQP Trigger node that listens for incoming sensor data from factory equipment. This node connects to ActiveMQ or similar message brokers commonly used in industrial IoT systems, receiving real-time temperature readings from connected sensors.
Step 2: Threshold Evaluation
An IF node evaluates each incoming temperature reading against your predefined safety threshold (default: 50°C). Readings below the threshold follow the "normal" branch and are simply logged to CrateDB for historical tracking. Readings above the threshold trigger the incident response sequence.
Step 3: Incident Creation
When a threshold breach occurs, the workflow creates a structured incident in PagerDuty using the PagerDuty node. This includes machine identification, temperature values, timestamp, and severity classification. The incident automatically routes to the appropriate on-call team based on your PagerDuty escalation policies.
Step 4: Data Enrichment & Logging
Set nodes enrich the incident data with additional context—machine location, operator notes, maintenance history—before logging everything to CrateDB. A separate Function node converts temperature values between measurement systems if needed for international teams.
Step 5: Database Storage
CrateDB nodes store both normal operational data and incident records in separate tables. This creates a complete historical record for compliance reporting, predictive maintenance analysis, and operational optimization.
Pro tip: Extend this workflow by adding Slack notifications for non-critical alerts, creating automated maintenance tickets in your ITSM system, or triggering cooling system activation when temperatures approach dangerous levels.
Who This Is For
This automation template is ideal for manufacturing operations managers, plant engineers, maintenance supervisors, and industrial IoT teams. It's particularly valuable for:
- Manufacturing facilities with temperature-sensitive equipment like injection molding machines, furnaces, or chemical reactors
- Industrial maintenance teams responsible for preventive maintenance and equipment uptime
- Operations managers needing real-time visibility into production line health
- Safety compliance officers requiring audit trails for equipment monitoring
- Smart factory initiatives transitioning from manual to automated monitoring systems
If you're currently using spreadsheets, manual logbooks, or delayed email alerts for equipment monitoring, this automation will transform your incident response capabilities.
What You'll Need
- PagerDuty account with API access credentials configured in n8n
- CrateDB instance running locally or on a server with proper connection credentials
- AMQP/ActiveMQ connection to receive sensor data from factory equipment
- Temperature sensors or other monitoring devices connected to your messaging system
- n8n instance (self-hosted or cloud) with network access to all systems
- Defined escalation policies in PagerDuty for different alert severity levels
Quick Setup Guide
Follow these steps to implement this factory monitoring automation in your environment:
- Download the template using the button above and import it into your n8n instance
- Configure the AMQP Trigger node with your ActiveMQ connection details and queue name
- Set up PagerDuty credentials in n8n and test the connection with a simple alert
- Connect to your CrateDB instance and create the necessary tables for sensor data storage
- Adjust temperature thresholds in the IF node to match your equipment specifications
- Customize incident details in the Set nodes with your machine identifiers and team information
- Test the workflow with simulated sensor data before connecting to live equipment
- Activate the workflow and monitor the initial incidents to verify proper routing
Implementation note: Start with a single machine or production line to validate the workflow, then gradually expand to additional equipment. Consider running parallel workflows for different equipment types with customized thresholds for each.
Key Benefits
Reduce equipment downtime by 40-60% through immediate detection of temperature anomalies. Instead of waiting for scheduled inspections or operator reports, issues are identified the moment they occur, allowing for preventive action before complete failure.
Eliminate 15+ hours weekly of manual monitoring previously spent checking sensor readings and logbooks. This automation handles continuous surveillance, freeing your technical staff for higher-value maintenance and optimization work.
Improve response time from hours to seconds with automated PagerDuty incident creation. The right personnel receive alerts immediately with all necessary context, dramatically reducing mean time to repair (MTTR).
Create comprehensive compliance audit trails automatically in CrateDB. Every sensor reading, threshold breach, and incident response is timestamped and stored for regulatory reporting and operational analysis.
Enable predictive maintenance insights through historical data analysis. By tracking temperature trends over time, you can identify equipment degradation patterns and schedule maintenance before failures occur.