What This Workflow Does
This automation solves the tedious manual process of exporting Meta Ads performance data and copying it into spreadsheets. Marketing teams waste hours each week downloading reports, reformatting data, and updating spreadsheets—time that could be spent optimizing campaigns.
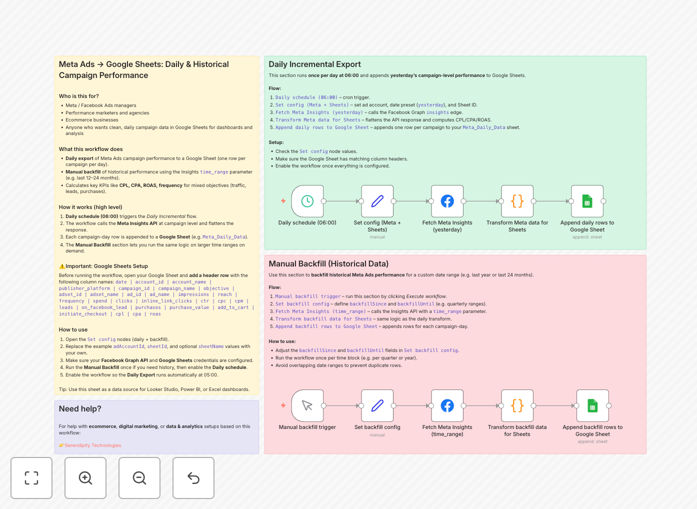
The workflow automatically pulls key metrics like impressions, clicks, conversions, spend, and ROAS from Meta Ads Manager and organizes them in Google Sheets. It creates both daily snapshots for current performance monitoring and historical records for long-term trend analysis.
How It Works
Step 1: Connect to Meta Ads API
The workflow authenticates with your Meta Ads account using OAuth, then queries the Marketing API for campaign performance data based on your specified date ranges and metrics.
Step 2: Transform and Structure Data
Raw API responses are processed into a clean, consistent format. The workflow handles metric calculations (like CTR and ROAS), date formatting, and campaign naming conventions.
Step 3: Update Google Sheets
Processed data gets written to designated Google Sheets tabs—one for daily updates that overwrites previous data, and another for historical records that append new rows while preserving past data.
Who This Is For
This workflow benefits digital marketers, agencies, and ecommerce businesses running Meta Ads campaigns. It's especially valuable for:
- Marketing teams needing consolidated reporting
- Agencies managing multiple client accounts
- Ecommerce stores tracking ad-driven sales
- Startups monitoring CAC and ROAS
What You'll Need
- A Meta Business account with Ads access
- A Google account with Sheets access
- n8n cloud account or self-hosted instance
- Basic understanding of Meta Ads metrics
Quick Setup Guide
- Download the JSON workflow file
- Import into your n8n instance
- Connect your Meta Ads and Google accounts
- Configure your target Google Sheet ID
- Set your preferred metrics and date ranges
- Test with a small date range first
- Schedule automatic runs (daily/weekly)
Pro tip: Create a dashboard tab in your Sheet that summarizes key metrics from the raw data tabs using QUERY or pivot tables for instant visibility.
Key Benefits
Save 5+ hours per month by eliminating manual data exports and spreadsheet updates. The automation handles everything from data collection to formatting.
Never lose historical data with automatic backfills that preserve your complete campaign performance history for year-over-year comparisons.
Make better decisions faster with always-updated performance data accessible to your entire team in Google Sheets.
Combine with other data sources to calculate blended ROAS across Meta, Google, and other ad platforms in one unified view.