What This Workflow Does
Customer churn silently drains revenue and growth. Most businesses discover attrition too late—after the customer has already left. This n8n workflow provides early warning by automatically monitoring dozens of churn indicators across your customer data sources.
It combines Bright Data's web scraping capabilities with OpenAI's AI analysis to identify patterns that signal potential churn: decreased product usage, negative support sentiment, payment issues, and competitive mentions. The system generates customer health scores, prioritizes at-risk accounts, and delivers actionable insights to your team before customers cancel.
Instead of manual spreadsheet tracking that consumes hours each week, this automation runs continuously in the background, transforming raw customer data into retention opportunities. It's particularly valuable for SaaS companies, subscription services, and any business with recurring revenue models where customer lifetime value directly impacts profitability.
How It Works
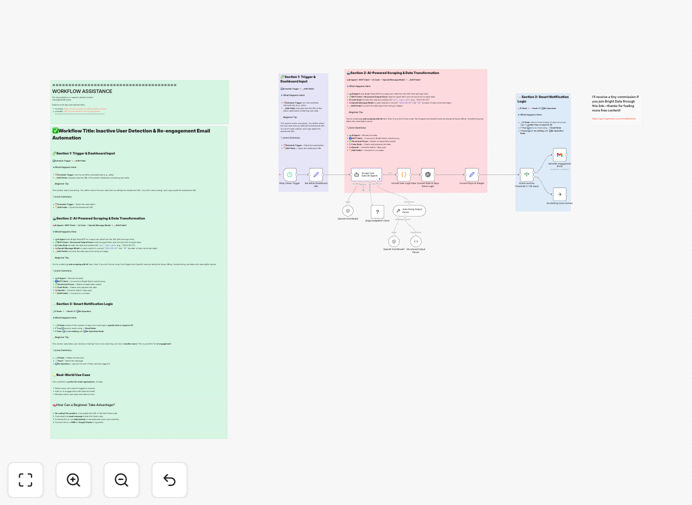
1. Data Collection & Aggregation
The workflow begins by gathering customer data from multiple sources. Bright Data MCP scrapes public signals, support ticket systems, and usage analytics platforms. Internal data from your CRM, billing system, and product analytics is also integrated to create a comprehensive customer profile.
2. AI-Powered Pattern Analysis
OpenAI analyzes the aggregated data to identify churn indicators. The AI looks beyond simple metrics to detect subtle patterns: changes in feature adoption, sentiment shifts in communications, engagement decay timelines, and comparative behavior against your most successful customers.
3. Risk Scoring & Prioritization
Each customer receives a churn probability score (low, medium, high) based on multiple weighted factors. The system prioritizes accounts needing immediate attention and categorizes them by intervention type—product education, support outreach, pricing discussion, or feature request follow-up.
4. Alerting & Reporting
Automated alerts are sent to customer success teams via Slack, email, or your project management tool. Detailed reports are generated in Google Sheets or your data warehouse, showing trends, at-risk segments, and retention opportunity metrics over time.
Who This Is For
This workflow delivers the most value to SaaS and subscription businesses with recurring revenue models. Customer success teams drowning in manual tracking will save 10-15 hours weekly. Revenue operations professionals needing to reduce churn for predictable growth will gain actionable insights. Product managers seeking to understand why customers leave will uncover feature gaps and usability issues.
It's also ideal for agencies managing client retainers, membership organizations with renewal cycles, and any business where customer retention directly impacts financial performance. Companies with 100+ active customers will see the clearest ROI, though smaller businesses can establish proactive retention practices early.
Pro tip: Start by monitoring just 3-5 key churn indicators specific to your business model. Common starting points include login frequency, support ticket volume/sentiment, and feature adoption rates. You can expand monitoring as the system proves value.
What You'll Need
- n8n instance (self-hosted version required for community nodes)
- Bright Data account with MCP access for web scraping capabilities
- OpenAI API key for AI analysis and pattern recognition
- Google Sheets or alternative data destination for reporting
- Access to customer data sources (CRM, support tickets, product analytics)
- Alerting channel (Slack, email, or project management tool for notifications)
Quick Setup Guide
Follow these steps to implement the churn monitoring workflow in your n8n environment:
- Import the template – Download the JSON file and import it into your n8n instance using the workflow import function.
- Configure credentials – Add your Bright Data MCP credentials, OpenAI API key, and Google Sheets connection in the credential management section.
- Customize data sources – Update the workflow nodes to point to your specific customer data sources (HubSpot, Salesforce, Zendesk, Intercom, etc.).
- Define churn indicators – Adjust the parameters to match your business's specific warning signs (usage thresholds, sentiment scores, time periods).
- Set up destinations – Configure where alerts should go (Slack channel, email addresses) and where reports should be stored (Google Sheet ID).
- Test with sample data – Run the workflow with a small subset of customer data to verify all connections and logic work correctly.
- Schedule execution – Set the workflow to run weekly (recommended) or daily based on your customer lifecycle and data freshness needs.
Key Benefits
Proactive retention instead of reactive damage control. Identify at-risk customers 30-90 days before they cancel, giving your team time to intervene with targeted retention efforts that actually work.
Save 10-15 hours weekly on manual tracking and analysis. Automate the tedious data gathering, spreadsheet updating, and report generation that currently consumes your customer success team's valuable time.
Improve retention rates by 5-15% with data-driven interventions. Move from gut-feel outreach to targeted actions based on actual churn indicators specific to each customer's situation and behavior patterns.
Uncover product and service issues before they scale. Spot feature adoption problems, support pain points, and competitive threats across your customer base, not just from the loudest complainers.
Scale customer success without linearly increasing headcount. Handle 2-3x more customers with the same team by automating monitoring and prioritization, focusing human effort where it matters most.