What This Workflow Does
Manually checking GitHub's trending page every day is time-consuming and inefficient. Developers, tech leads, and open-source enthusiasts need to stay updated on emerging projects, but browsing through dozens of repositories takes valuable time away from actual development work.
This n8n workflow automates the entire process. It scrapes GitHub's trending repositories page, extracts structured data including project names, descriptions, programming languages, star counts, and direct links, then formats this information for easy consumption. What used to be a 30-minute daily task becomes a fully automated process that runs in the background.
The output is clean, structured data that you can send to Slack, store in a database, or use to generate weekly trend reports. This gives your team a competitive edge by identifying promising new tools and libraries before they become mainstream.
How It Works
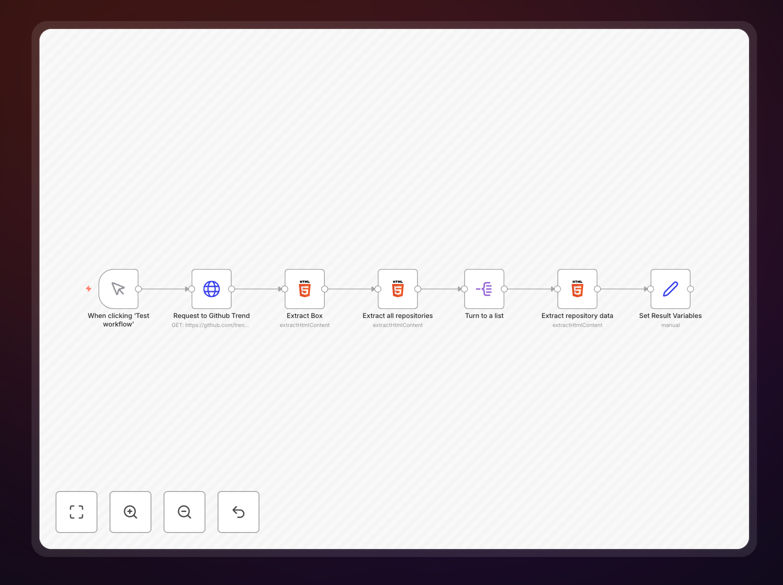
The workflow follows a logical sequence to extract, process, and deliver GitHub trending data.
Step 1: Trigger Execution
The workflow can be triggered manually for testing or scheduled to run automatically every day. A manual trigger node allows you to test the entire process with one click before setting up automation.
Step 2: Fetch GitHub Trending Page
An HTTP Request node sends a request to GitHub's trending repositories page. This retrieves the raw HTML containing all the trending project data for the current day.
Step 3: Extract Repository Containers
HTML Extract nodes parse the page structure to isolate each repository entry. The workflow identifies the specific HTML elements that contain individual project information.
Step 4: Parse Detailed Repository Data
Additional processing nodes extract specific fields from each repository container: project name, author, description, primary language, stars gained, and the repository URL.
Step 5: Structure and Format Data
Set nodes clean and organize the extracted information into a consistent JSON structure. This makes the data ready for integration with other applications and tools.
Step 6: Deliver Results
The final formatted data can be sent to various destinations: posted to a Slack channel, saved to Google Sheets or Airtable, added to a database, or emailed as a daily digest.
Pro tip: Schedule this workflow to run at 9 AM daily to have fresh trending data waiting for your team at the start of each workday. Combine it with a Slack integration to automatically post the top 5 trending repositories to your development channel.
Who This Is For
This automation is ideal for development teams, tech leads, open-source contributors, and technology researchers. Development managers can use it to keep their teams informed about new tools. Startup founders can identify emerging technologies relevant to their space. Open-source maintainers can track what's gaining popularity in their ecosystem.
Tech recruiters and talent acquisition specialists can use this data to understand what skills are trending in the developer community. Investors and analysts can spot early signals about which technologies are gaining developer mindshare before they hit mainstream adoption.
What You'll Need
- A running n8n instance (self-hosted or n8n.cloud)
- Basic understanding of n8n's interface
- Optional: Slack, Google Sheets, or Airtable credentials if you want to send data to these services
- Optional: A scheduler (n8n's built-in scheduler or external cron) for automated daily execution
Quick Setup Guide
- Download the template using the button above
- Import the JSON file into your n8n instance (Settings → Import Workflow)
- Test the workflow manually by clicking "Execute Workflow"
- Review the output data in the last node
- Configure any destination nodes (Slack, Google Sheets, etc.) with your credentials
- Set up scheduling if you want daily automated execution
- Monitor the workflow for a few days and adjust filters as needed
Pro tip: Before connecting to external services, run the workflow a few times to ensure it's extracting data correctly. Check the output against GitHub's actual trending page to verify accuracy.
Key Benefits
Save 5-10 hours per week that would otherwise be spent manually browsing GitHub. That's 250-500 hours annually that your team can redirect toward actual development work.
Get structured, actionable data instead of unstructured browsing. The workflow outputs clean JSON that can be analyzed, filtered, and integrated with your existing tools and dashboards.
Never miss emerging trends because the automation runs consistently, even when your team is busy with other priorities. You'll get notified about promising new projects as they start gaining traction.
Make data-driven technology decisions based on what's actually trending in the developer community rather than gut feelings or outdated information.
Customize and extend easily since n8n's visual interface makes it simple to add filters, integrate with additional services, or modify the data structure to match your specific needs.