What This Workflow Does
Workplace discrimination often goes undetected because patterns are hidden across thousands of employee reviews and feedback points. Manual analysis is time-consuming, subjective, and rarely scales. This automation solves that by systematically identifying bias indicators using AI and statistical methods.
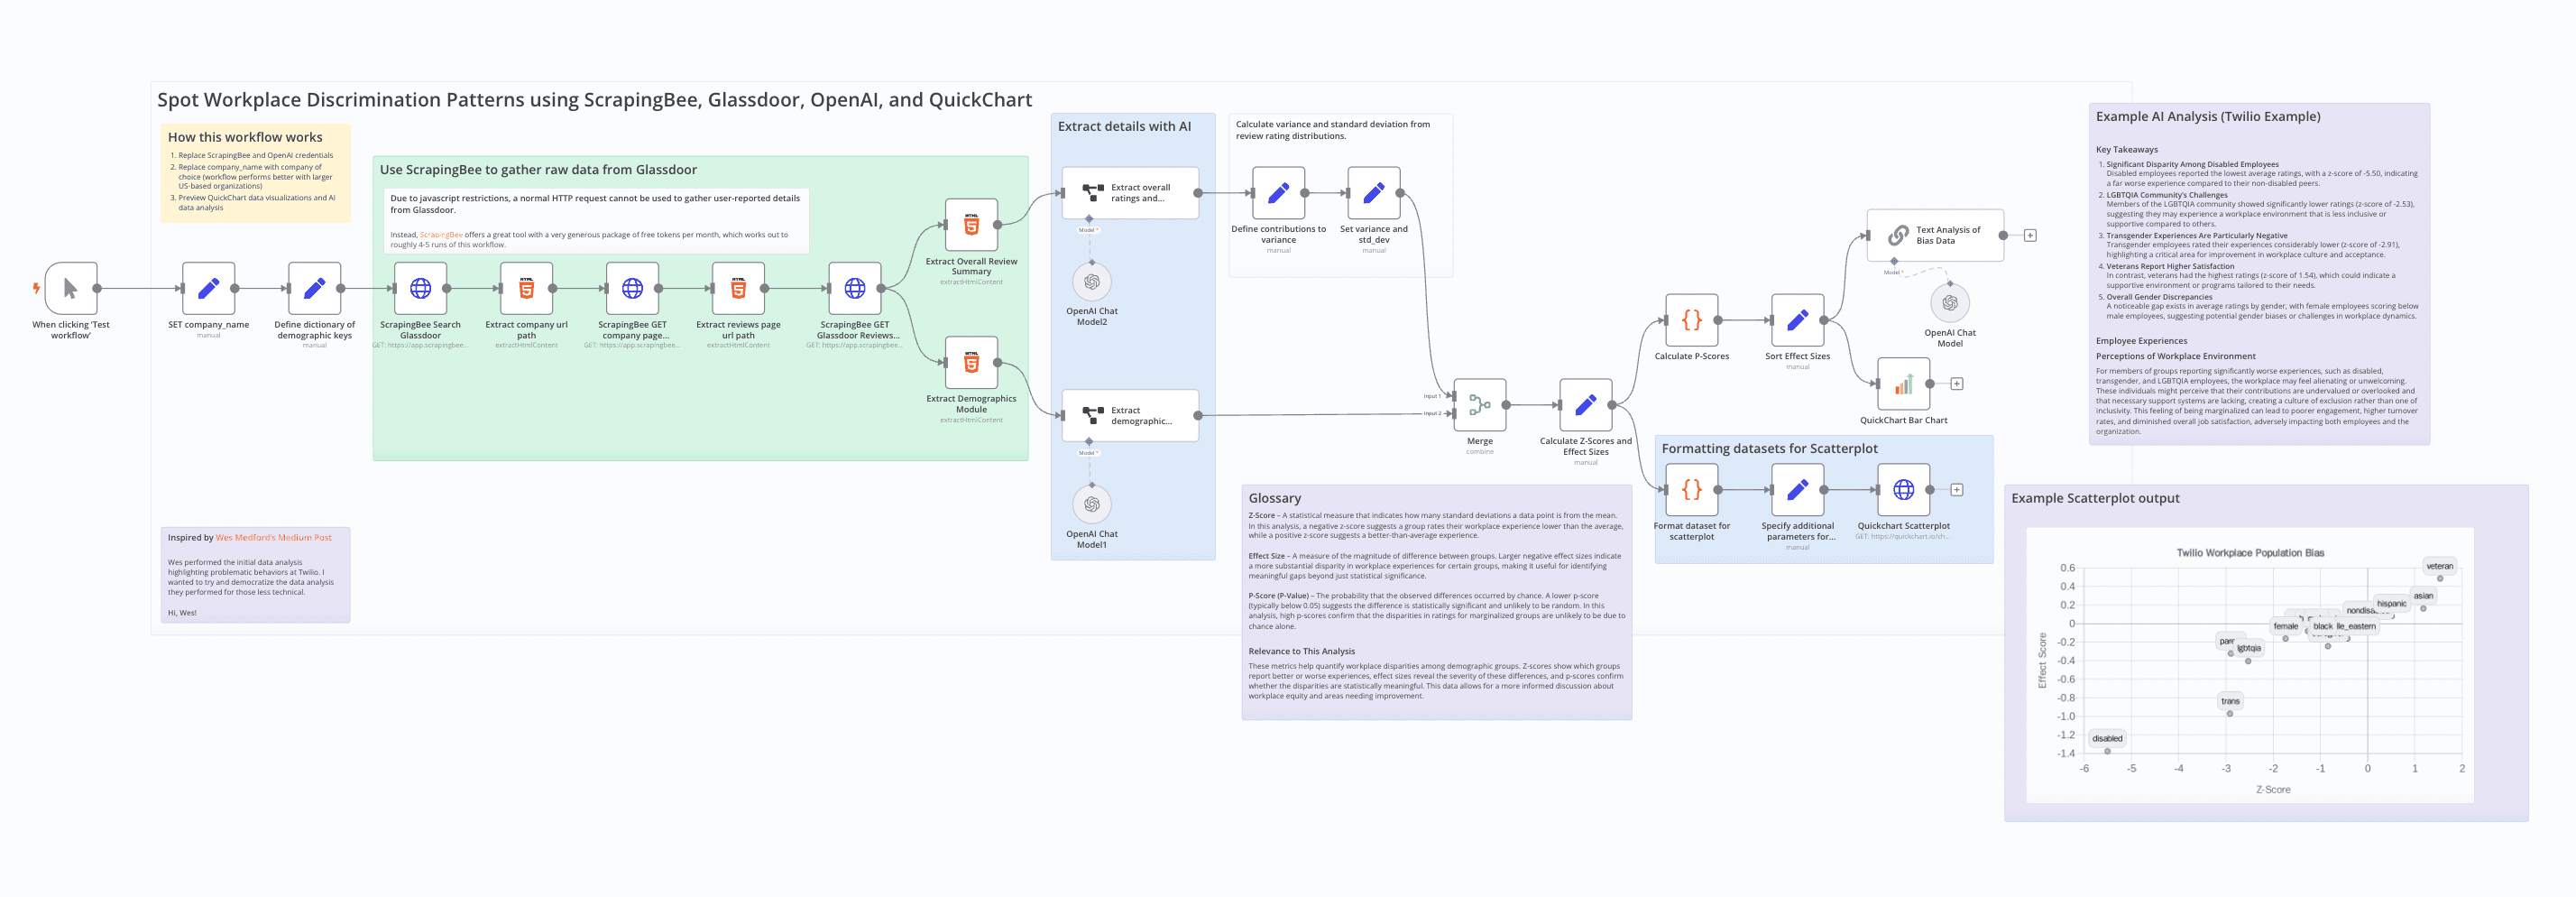
The workflow scrapes public review data from platforms like Glassdoor, uses AI to extract demographic-based ratings and sentiment, then calculates statistical disparities (z-scores, effect sizes, p-values) to highlight potential discrimination patterns. It generates visual reports that help HR teams, DEI officers, and company leadership make data-driven decisions to improve workplace equity.
How It Works
Step 1: Data Collection
The workflow uses ScrapingBee to gather company review data from Glassdoor. It extracts ratings, text reviews, job titles, locations, and dates—creating a structured dataset for analysis while respecting rate limits and terms of service.
Step 2: AI-Powered Analysis
OpenAI's models process review text to identify mentions of demographic factors (gender, race, age, etc.) and associated sentiment. The AI classifies reviews by potential bias categories and extracts quantitative ratings for different demographic groups.
Step 3: Statistical Calculation
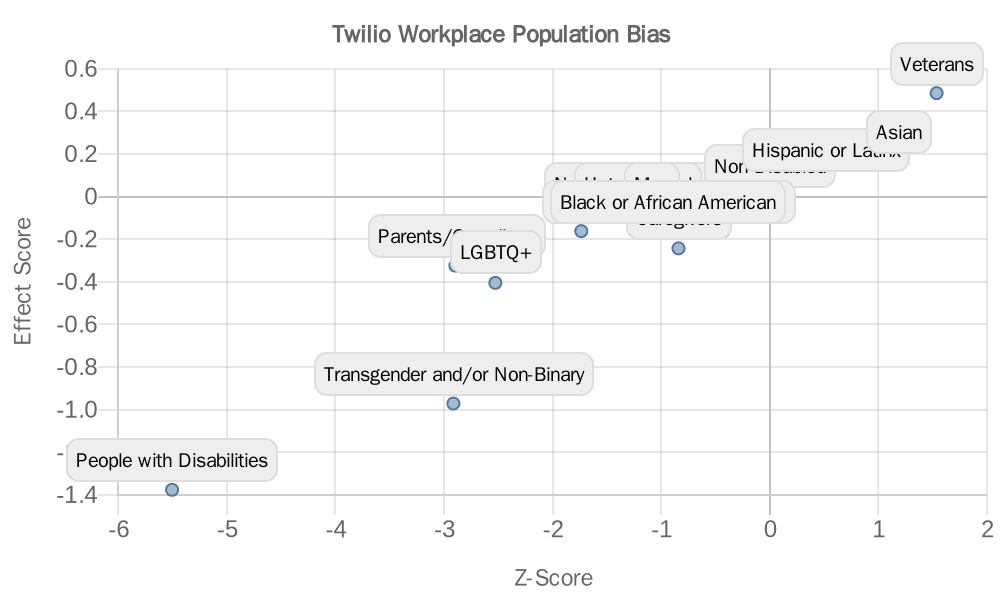
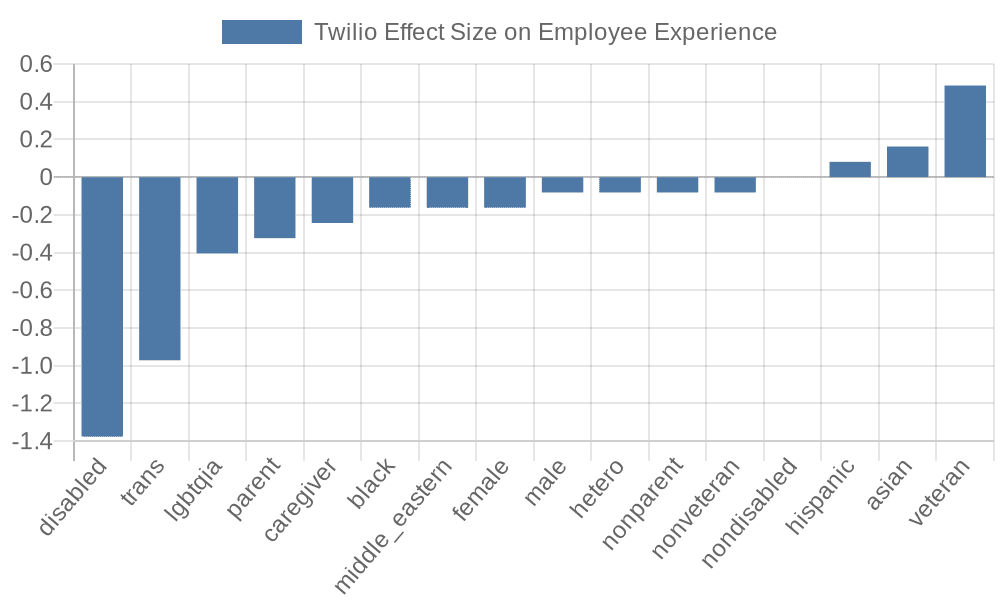
Custom code nodes calculate z-scores to show how far each group's ratings deviate from company averages. Effect size measures the magnitude of differences, while p-values assess statistical significance. This transforms subjective impressions into objective metrics.
Step 4: Visualization & Reporting
The workflow generates scatter plots showing rating distributions, bar charts comparing group averages, and summary tables highlighting the most significant disparities. Reports are compiled into formatted documents or dashboards for stakeholder review.
Who This Is For
This template is ideal for HR departments, Diversity & Inclusion teams, organizational psychologists, management consultants, and employee advocacy groups. Companies with 100+ employees, especially those in regulated industries or with public diversity commitments, will find immediate value. Researchers studying workplace dynamics and journalists investigating corporate culture can also use this for evidence-based reporting.
What You'll Need
- n8n instance (cloud or self-hosted)
- ScrapingBee account for web scraping (or alternative like ScrapingDog)
- OpenAI API key for text analysis (GPT-3.5 or GPT-4)
- Basic understanding of statistical concepts (z-scores, p-values)
- Target company names for analysis (publicly traded companies work best)
Pro tip: Start with large, well-known companies that have thousands of Glassdoor reviews. The statistical analysis becomes more reliable with larger sample sizes (100+ reviews per demographic group).
Quick Setup Guide
- Import the template: Download the JSON file and import it into your n8n instance.
- Configure credentials: Add your ScrapingBee and OpenAI API keys to the respective nodes.
- Set target company: Modify the "Company Name" parameter in the HTTP Request node to analyze your chosen organization.
- Adjust parameters: Review the statistical thresholds (z-score > 2.0, p-value < 0.05) and modify if needed for your sensitivity requirements.
- Test run: Execute the workflow with a small sample first to verify data collection and analysis logic.
- Schedule automation: Set the workflow to run monthly to track changes in discrimination patterns over time.
Key Benefits
Save 80+ hours per analysis compared to manual review of employee feedback. What traditionally takes weeks of HR team time completes automatically in hours.
Objective, data-driven insights replace subjective interpretations. Statistical measures provide defensible evidence for policy changes and intervention programs.
Proactive risk mitigation helps identify discrimination patterns before they escalate to lawsuits or public relations crises, protecting both employees and company reputation.
Benchmarking capability allows comparison across departments, locations, or time periods to measure the impact of diversity initiatives and track progress toward equity goals.
Scalable to entire organization—once configured, the same workflow can analyze multiple companies, business units, or review periods with minimal additional effort.