What This Workflow Does
Sales teams often struggle with manual reporting. Managers spend hours each week copying deal data from Pipedrive into spreadsheets to track pipeline health, forecast revenue, and analyze performance. This process is error-prone, time-consuming, and delays decision-making.
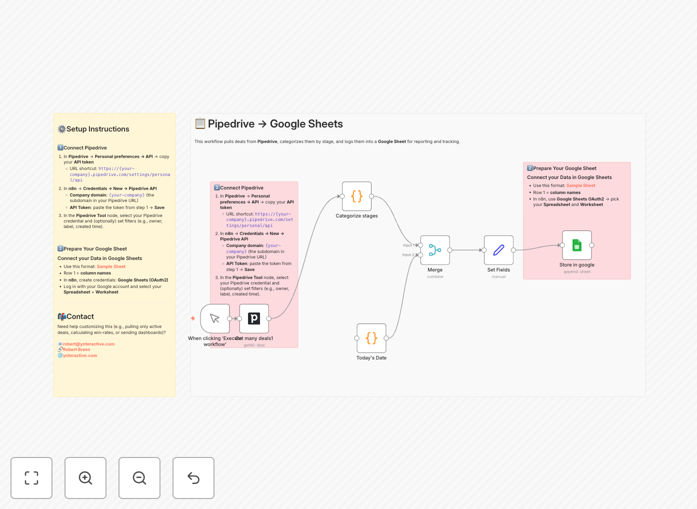
This automation workflow solves that problem by automatically pulling all deals from your Pipedrive CRM, categorizing them by their current stage (like Prospecting, Qualified, Proposal, Negotiation, or Closed Won), and logging them into a structured Google Sheet. It adds a date stamp for each sync, creating a historical record of your pipeline's evolution.
The result is a live, accurate sales report that updates automatically. You gain real-time visibility into deal progress, stage distribution, and potential revenue without any manual data entry. This transforms reporting from a weekly chore into a continuous strategic tool.
How It Works
Step 1: Fetch Deals from Pipedrive
The workflow starts by connecting to your Pipedrive account via its API. It retrieves all active deals, including key details like deal name, value, stage ID, owner, and custom fields. You can configure filters to pull only specific deals if needed.
Step 2: Map Stage IDs to Friendly Names
Pipedrive uses internal stage IDs. The workflow translates these IDs into human-readable stage names (e.g., "Prospecting," "Closed Won") using a mapping table. This makes the output immediately understandable for anyone viewing the report.
Step 3: Add Timestamp and Structure Data
A current date stamp is added to each deal record. The workflow then organizes the data into clean columns: Deal Name, Stage, Value, Owner, Date Added, and any other relevant fields you choose to include.
Step 4: Append to Google Sheets
The structured data is appended as new rows to your designated Google Sheet. The sheet acts as a growing log of your pipeline, preserving historical data for trend analysis. You can set the automation to run daily, weekly, or on any schedule.
Who This Is For
This workflow is ideal for sales managers, operations teams, and business owners who use Pipedrive and need better reporting. Specifically:
- Sales Managers who need real-time pipeline visibility to forecast accurately and coach their team.
- Startups and SMBs that lack dedicated analytics tools but want professional sales reporting.
- Operations Teams responsible for generating weekly sales performance reports for leadership.
- Consultants and Agencies managing client sales pipelines who need transparent reporting.
- Any team that combines CRM data with other business metrics in spreadsheets for analysis.
What You'll Need
- A Pipedrive account with deals in your pipeline.
- A Google Sheets spreadsheet prepared with column headers (Deal Name, Stage, Value, etc.).
- Access to n8n (self-hosted or cloud) to import and run the workflow.
- Your Pipedrive API token (available in Personal Preferences → API settings).
- Google OAuth2 credentials for Sheets integration (set up within n8n).
Quick Setup Guide
- Download the template using the button above and import it into your n8n instance.
- Create credentials in n8n for Pipedrive (using your API token) and Google Sheets (OAuth2).
- Configure the Pipedrive node to select your account and optionally set filters (owner, label, date).
- Configure the Google Sheets node to select your spreadsheet and worksheet.
- Test the workflow by executing it once to verify data flows correctly into your sheet.
- Schedule the automation to run daily or weekly based on your reporting needs.
Pro tip: Start by syncing all deals to get a full baseline. Later, customize the workflow to filter out lost deals or include only high-value opportunities to keep reports focused.
Key Benefits
Save 5–10 hours per month on manual reporting. Eliminate the tedious copy-paste process from CRM to spreadsheet. Sales managers regain time for coaching and strategy.
Improve forecast accuracy with real-time data. Decisions based on yesterday's data lead to missed opportunities. Automated syncing ensures forecasts reflect the current pipeline.
Create historical trend analysis effortlessly. Each sync adds dated records, building a timeline of pipeline changes. Spot seasonal patterns, stage conversion rates, and velocity trends.
Share live reports with stakeholders instantly. Google Sheets are easily shared. Finance, marketing, and leadership can access up-to-date pipeline views without requesting manual reports.
Reduce data errors and inconsistencies. Manual entry introduces mistakes. Automation ensures every deal is captured exactly as it appears in Pipedrive, improving data integrity.