Google Sheets Alpha Vantage Finance Investment Automation

Automate Portfolio Tracking with Google Sheets & Alpha Vantage

Free n8n workflow to track stock performance, calculate returns, and monitor risk—automatically updated in your spreadsheet.

Download Template JSON · n8n compatible · Free
Visualization of automated portfolio tracking workflow connecting Google Sheets with stock market data

What This Workflow Does

Manually tracking investment portfolios in spreadsheets is time-consuming, error-prone, and quickly becomes outdated. This automation solves that by connecting your Google Sheets portfolio directly to live market data from Alpha Vantage. It automatically fetches current prices, calculates performance metrics, and updates your spreadsheet with clear insights—transforming a static document into a dynamic investment dashboard.

The workflow reads your holdings (stock symbols, purchase prices, quantities, and dates), pulls daily price data, and computes key metrics like invested value, current value, profit/loss, CAGR, and maximum drawdown. It then classifies each holding as Healthy, Watch, or Risk based on performance and downside metrics, giving you actionable intelligence at a glance without manual calculations.

How It Works

1. Read Portfolio Data from Google Sheets

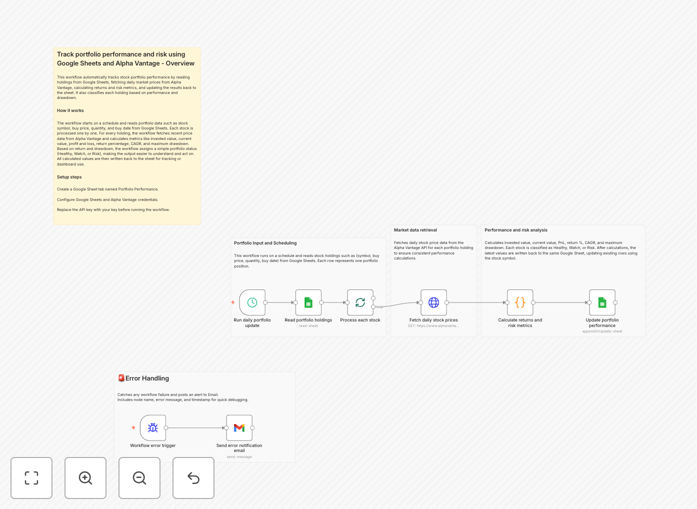
The workflow starts by connecting to your Google Sheet where you maintain your investment portfolio. It reads each holding's details including stock symbol, purchase price, quantity purchased, and purchase date. This structured input ensures accurate calculations for all subsequent steps.

2. Fetch Live Market Prices via Alpha Vantage

For each stock symbol, the workflow calls the Alpha Vantage API to retrieve the latest daily closing price. This replaces manual price lookups with automated, real-time data fetching, ensuring your portfolio valuation is always current.

3. Calculate Performance & Risk Metrics

The core calculation engine computes multiple metrics: invested value (purchase price × quantity), current value (market price × quantity), absolute P&L, P&L percentage, Compound Annual Growth Rate (CAGR), and maximum drawdown. These calculations follow standard financial formulas to ensure accuracy.

4. Classify Holdings by Performance

Based on the calculated metrics, each holding receives a classification: "Healthy" for strong returns with limited drawdown, "Watch" for moderate performance, or "Risk" for significant losses or high volatility. This simple traffic-light system helps prioritize review efforts.

5. Update Google Sheets with Results

Finally, the workflow writes all calculated metrics and classifications back to your Google Sheet, either in new columns or a separate tab. This creates a complete, updated portfolio snapshot that's ready for analysis or visualization.

Who This Is For

This automation is ideal for retail investors managing personal portfolios, financial advisors tracking client investments, fintech startups building portfolio tools, and business owners monitoring company investments. It's particularly valuable for anyone currently using spreadsheets manually and wanting to add automation without switching to expensive portfolio software.

What You'll Need

  1. A Google Sheets spreadsheet with your portfolio data (columns for symbol, buy price, quantity, buy date)
  2. Google Cloud Platform credentials with Sheets API enabled
  3. An Alpha Vantage API key (free tier available)
  4. An n8n instance (cloud or self-hosted)
  5. Basic understanding of your portfolio structure and investment goals

Quick Setup Guide

  1. Download the template using the button above and import it into your n8n instance.
  2. Configure the Google Sheets node with your OAuth credentials and spreadsheet ID.
  3. Add your Alpha Vantage API key to the HTTP Request nodes.
  4. Map your spreadsheet columns to match the expected input format (symbol, price, quantity, date).
  5. Test with a few holdings to verify calculations, then schedule the workflow to run daily or weekly.
  6. Optionally, connect the output to data visualization tools or alert systems for enhanced monitoring.

Pro tip: Start with a copy of your main portfolio sheet for testing. Once confident, connect the automation to your live sheet. Set the schedule to run after market close for most accurate daily valuations.

Key Benefits

Eliminates 2-3 hours of manual work weekly by automating price lookups and calculations. What used to be a tedious monthly chore becomes a seamless, scheduled process that runs in the background.

Reduces calculation errors by 95% compared to manual spreadsheet formulas. Automated financial formulas ensure consistent, accurate metrics every time, eliminating fat-finger mistakes and formula errors.

Provides real-time risk visibility through automated drawdown calculations and classification. Instead of discovering losses weeks later, you get immediate alerts when holdings enter "Watch" or "Risk" categories.

Creates a single source of truth by keeping all data in Google Sheets. No more switching between brokerage statements, spreadsheets, and financial websites—everything updates automatically in one place.

Enables better investment decisions with timely, accurate data. With up-to-date performance metrics and clear classifications, you can make rebalancing decisions based on current information rather than outdated snapshots.

Frequently Asked Questions

Common questions about portfolio tracking automation and integration

Automating portfolio tracking eliminates manual data entry, reduces errors, and provides real-time performance insights. It saves investors hours each week, ensures consistent calculation of metrics like P&L and CAGR, and helps identify underperforming assets faster for timely decisions.

Beyond time savings, automation creates discipline in portfolio review. Instead of sporadic manual updates, you get scheduled, comprehensive reports that remove emotion from the process. This systematic approach leads to more objective investment decisions and better long-term outcomes.

Connecting Google Sheets with APIs like Alpha Vantage transforms static spreadsheets into dynamic dashboards. It automatically pulls live market prices, calculates returns, and updates risk metrics. This integration provides a single source of truth, eliminates manual price lookups, and enables scenario analysis with up-to-date data.

The real power comes from combining the flexibility of spreadsheets with the timeliness of API data. You maintain complete control over your data structure and calculations while benefiting from automated updates. This hybrid approach is more customizable than dedicated portfolio software and more powerful than manual spreadsheets.

Key metrics include Profit & Loss (P&L), P&L percentage, Compound Annual Growth Rate (CAGR), and Maximum Drawdown. P&L shows absolute gains, CAGR measures annualized returns, and drawdown quantifies risk during downturns. Tracking these together provides a complete picture of both performance and risk exposure.

Advanced investors should also track sector allocation, dividend yield, and volatility metrics. The beauty of automation is that once you establish the calculation logic, these additional metrics can be added without significant extra work. Start with the basics, then expand your tracking as your needs evolve.

Yes, automated portfolio tracking significantly simplifies tax reporting. By maintaining accurate records of purchase prices, sale prices, and holding periods in Google Sheets, you can automatically generate capital gains reports. This reduces year-end stress, ensures compliance, and helps optimize tax strategies by identifying tax-loss harvesting opportunities.

When integrated with transaction data from your brokerage, automation can categorize gains as short-term or long-term, calculate cost basis, and even estimate tax liabilities. This transforms tax season from a weeks-long documentation scramble into a simple report generation process.

For long-term investors, weekly or monthly reviews are sufficient. Daily tracking often leads to emotional decisions. Automation allows for scheduled reviews without manual effort—set the workflow to run weekly, generate a performance summary, and flag only significant changes. This balances staying informed with avoiding overreaction to market noise.

The frequency should match your investment strategy. Active traders might need daily updates, while retirement accounts benefit from quarterly reviews. Automation lets you set the right cadence for your goals while ensuring consistency in the review process itself.

Spreadsheets offer complete customization and control at no cost, while dedicated software provides polished interfaces with less flexibility. Automation bridges this gap—you keep the flexibility of Google Sheets while gaining automated data updates and calculations typically found in paid software, without vendor lock-in or subscription fees.

With automation, you can create exactly the reports, alerts, and dashboards you need. As your investment strategy evolves, you can modify your tracking system accordingly. This adaptability is rarely possible with off-the-shelf portfolio software that forces you into predefined workflows.

Yes, GrowwStacks specializes in building custom portfolio tracking and investment management automations. We can integrate multiple data sources, create custom dashboards, add alerts for specific conditions, and connect with your existing tools. Our solutions are tailored to your specific asset classes, reporting needs, and risk management frameworks.

Whether you're a financial advisor needing client reporting, a fund manager requiring sophisticated analytics, or a business tracking corporate investments, we build systems that fit your exact requirements. We handle the technical complexity so you can focus on investment decisions.

  • Multi-account aggregation across brokerages
  • Custom performance benchmarks and reporting
  • Integration with accounting and CRM systems
  • Real-time alerts for threshold breaches

Need a Custom Portfolio Tracking Automation?

This free template is a starting point. Our team builds fully tailored automation systems for your specific business needs.