What This Workflow Does
Manual website traffic analysis is a drain on marketing and SEO teams. Checking SEMrush dashboards, copying numbers, and updating spreadsheets eats up hours every week. This workflow solves that by automating the entire process.
It connects the SEMrush Website Traffic Checker API directly to Google Sheets, pulling key metrics like visits, bounce rate, page views, sessions, and traffic sources automatically. Whether you're tracking your own site, client portfolios, or competitor performance, this automation ensures data flows consistently into your reporting system without manual intervention.
The result is a live, structured dataset ready for analysis, dashboard creation, or alerting. You gain reliable insights faster, reduce human error, and free up team time for strategic work instead of data collection.
How It Works
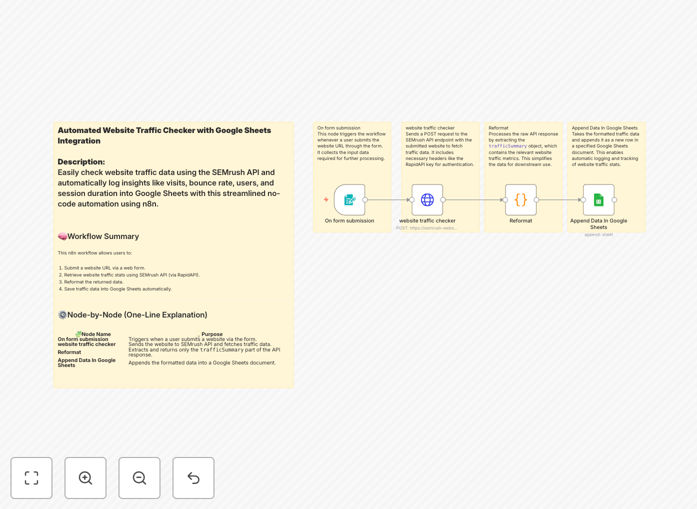
Step 1: Trigger via Form Submission
The workflow starts when a website URL is submitted through a simple form (built with n8n's Form Trigger node). This input triggers the automation and passes the URL to the next step.
Step 2: Fetch Data from SEMrush API
An HTTP Request node calls the SEMrush Website Traffic Checker API via RapidAPI. It sends the submitted URL and retrieves a detailed traffic summary including visits, bounce rate, page views, sessions, and source breakdown.
Step 3: Reformat and Structure the Response
A Set node parses the API response, extracting only the relevant metrics under trafficSummary. It cleans and structures the data into a consistent format suitable for spreadsheet logging.
Step 4: Append Data to Google Sheets
The formatted data is sent to a Google Sheets node, which appends it as a new row in your designated spreadsheet. Columns typically include URL, visits, bounce rate, page views, sessions, and timestamp.
Who This Is For
This template is ideal for digital marketers, SEO specialists, data analysts, and business owners who need regular traffic insights without manual labor.
SEO Agencies: Automate client reporting by tracking multiple websites and populating shared dashboards.
Content Teams: Monitor article performance and identify high‑traffic pages to guide editorial strategy.
Competitor Analysts: Benchmark rival sites automatically to spot market trends and opportunities.
Small Business Owners: Keep an eye on website health and marketing ROI with minimal effort.
What You'll Need
- A SEMrush API key from RapidAPI (free tier available).
- A Google Sheets spreadsheet with columns prepared for traffic data.
- n8n installed (cloud or self‑hosted).
- Basic understanding of how to set up API credentials in n8n.
Pro tip: Use the free SEMrush API plan for testing. For production, consider a paid plan for higher request limits and more detailed metrics.
Quick Setup Guide
- Download the template JSON file and import it into your n8n instance.
- Get your SEMrush API key from RapidAPI and add it to the HTTP Request node headers.
- Connect your Google Sheets node to your spreadsheet and define the column mapping.
- Test by submitting a website URL through the form trigger or a manual webhook.
- Verify that data appears correctly in your Google Sheet.
- Schedule the workflow to run daily or weekly for ongoing monitoring.
Key Benefits
Save 5–10 hours per month on manual traffic checking and spreadsheet updates. Automation handles the repetitive data collection so your team can focus on analysis.
Improve data accuracy by eliminating copy‑paste errors. Automated logging ensures consistent formatting and timestamping.
Enable real‑time decision‑making with live data feeds. Spot traffic drops or surges immediately and adjust campaigns accordingly.
Scale effortlessly across multiple websites or clients. The same workflow can monitor dozens of URLs with minimal configuration changes.
Build custom dashboards using Google Sheets as a data source. Connect to Looker Studio, Tableau, or internal tools for visual reporting.