What This Workflow Does
This automation transforms how you manage your investments by replacing hours of manual research with systematic, AI-powered analysis. It's designed for investors who want data-driven insights without the emotional bias or time commitment of traditional portfolio review.
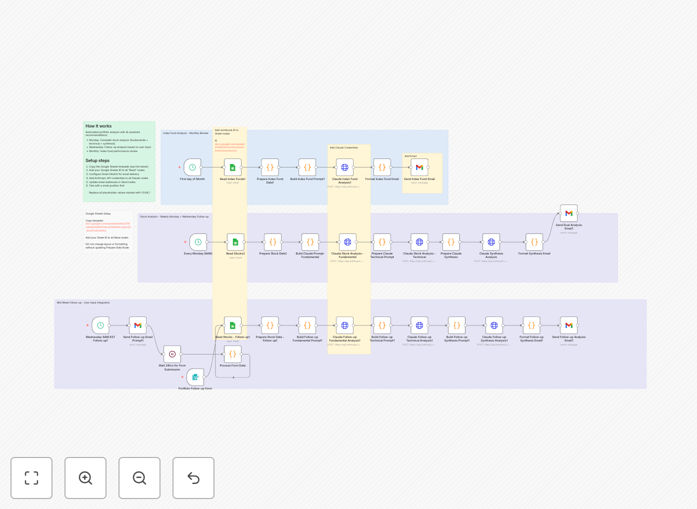
The workflow connects your Google Sheets portfolio tracker with Claude AI's analytical capabilities and delivers comprehensive reports directly to your Gmail. It performs both fundamental analysis (company financials, earnings, news sentiment) and technical analysis (price patterns, indicators) to give you balanced investment recommendations.
Beyond simple monitoring, it includes an interactive feedback loop—midweek check-ins let you provide additional context or documents, which the system incorporates into refined analysis. This creates a collaborative relationship between your investment intuition and AI's data processing power.
How It Works
1. Portfolio Data Collection
The workflow begins by reading your current stock and ETF holdings from a designated Google Sheets spreadsheet. It handles both whole shares and fractional positions, ensuring accurate portfolio representation.
2. Dual-Analysis Execution
For each holding, Claude AI with web search capability performs deep fundamental analysis—examining financial statements, recent earnings, news sentiment, and industry trends. Simultaneously, technical analysis evaluates price movements, volume patterns, and key indicators like RSI and moving averages.
3. Recommendation Synthesis
The system combines both analytical approaches into clear buy/sell/hold recommendations with reasoning. It weighs fundamental strength against technical positioning to provide balanced guidance rather than chasing short-term price movements.
4. Automated Reporting
Comprehensive HTML reports are generated and delivered to your Gmail inbox every Monday. These include position summaries, analysis highlights, and actionable recommendations formatted for easy reading on any device.
5. Interactive Refinement
On Wednesdays, the system sends a follow-up email asking for additional input. If you reply with documents, questions, or market observations, it runs supplemental analysis incorporating your feedback and updates recommendations accordingly.
Who This Is For
This workflow is ideal for part-time investors, financial advisors managing client portfolios, and anyone who wants systematic investment analysis without paying for expensive financial software. It's particularly valuable for:
- Busy professionals who want to stay informed about their investments but lack time for daily research
- Long-term investors seeking disciplined, emotion-free portfolio monitoring
- Financial advisors needing scalable client reporting systems
- ETF and index fund holders who want regular performance and allocation reviews
- DIY investors building their own automated financial dashboards
What You'll Need
- Google Sheets portfolio tracker with your current holdings (template provided)
- Gmail account for receiving analysis reports
- Anthropic API key for Claude AI access (sign up at console.anthropic.com)
- n8n account (cloud or self-hosted) to run the automation
- Basic spreadsheet skills to maintain your holdings data
Quick Setup Guide
Follow these steps to implement this automated analysis system:
- Duplicate the template – Copy the provided Google Sheets template and populate it with your investment positions.
- Connect your accounts – Authorize n8n to access your Google Sheets and Gmail accounts.
- Configure Claude AI – Add your Anthropic API credentials to enable the analysis engine.
- Update placeholders – Replace the sample email address, spreadsheet ID, and webhook identifiers with your own.
- Set your schedule – The workflow defaults to Monday 12pm EST for main analysis and Wednesday 12pm EST for follow-ups—adjust as needed.
- Test and activate – Run a manual test with a few holdings, then activate the schedule to begin automated weekly analysis.
Pro tip: Start with just 3-5 holdings to verify the analysis quality before scaling to your full portfolio. This lets you refine prompts and formatting without overwhelming your inbox.
Key Benefits
Saves 5+ hours weekly that would otherwise be spent manually researching holdings, reading earnings reports, and tracking market news. The automation does the heavy lifting while you focus on decision-making.
Reduces emotional investing by providing consistent, data-driven analysis regardless of market sentiment. This helps avoid panic selling during downturns and FOMO buying during rallies.
Improves portfolio diversification awareness through automated sector and concentration analysis. The system flags when any single position becomes disproportionately large relative to your overall portfolio.
Creates an investment journal automatically with weekly reports that document your portfolio's evolution, analysis rationale, and decision points—valuable for tax planning and performance review.
Scales with your portfolio from a few holdings to hundreds without additional time investment. The same system that works for personal investing can be adapted for professional financial advisory use.