What This Workflow Does
Manual sales reporting is a time-consuming, error-prone process that distracts your team from actual selling. This automation solves that by creating a dynamic weekly sales report that pulls live data from your Airtable CRM, calculates critical business metrics, and delivers a beautifully formatted update directly to your team's Slack channel.
The workflow calculates total pipeline value, weighted pipeline (adjusted by deal stage probability), top deals to watch, closed revenue for the period, and overall win rate. It transforms raw deal data into actionable insights that help sales managers forecast accurately, identify bottlenecks, and keep the entire team aligned without scheduling another meeting.
How It Works
The automation follows a logical sequence that mimics how a sales operations manager would analyze data, but does it instantly and consistently every week.
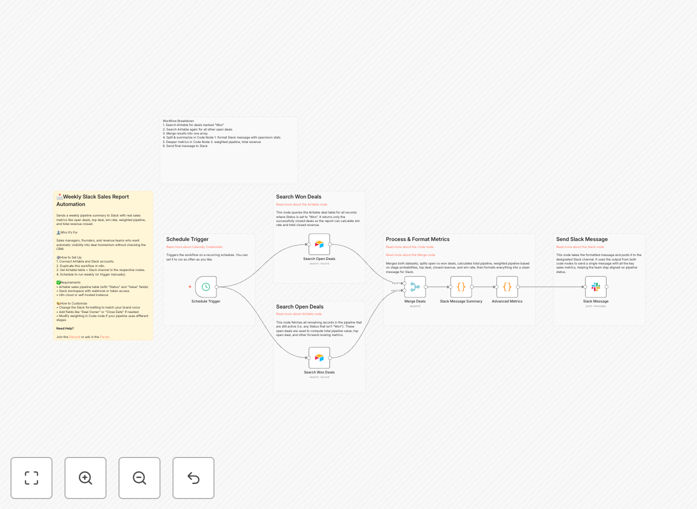
Step 1: Schedule Trigger
The workflow activates on a schedule you set (typically Monday morning). This ensures your team starts the week with fresh pipeline visibility without anyone having to remember to run reports.
Step 2: Fetch Deal Data from Airtable
It connects to your Airtable base and retrieves all active deals, filtering by relevant fields like deal name, value, stage, close date, and status. The template is configured to work with standard sales pipeline structures but can be customized for your specific Airtable setup.
Step 3: Calculate Key Metrics
Using built-in code nodes, the workflow performs calculations that would normally take hours in spreadsheets: sums total pipeline value, applies stage-based probability weights, identifies the largest deals, totals closed-won revenue for the period, and computes win rate percentage.
Step 4: Format for Readability
The raw numbers are transformed into a clean, readable format using Markdown. This includes emojis for visual scanning, bold headings for key metrics, and clear section breaks that make the report scannable in seconds.
Step 5: Deliver to Slack
The formatted report is sent to your designated Slack channel (like #sales-updates or #pipeline-review). The message appears as if a team member posted it, but it's generated automatically with perfect accuracy every time.
Who This Is For
This automation is ideal for sales teams of 5-50 people who use Airtable as their CRM or deal tracking system. Sales managers, operations specialists, and team leaders who spend 2+ hours weekly compiling reports will benefit immediately. Startups and scale-ups that need better visibility without investing in expensive enterprise reporting tools will find this template particularly valuable.
It's also perfect for remote or distributed teams that rely on asynchronous communication in Slack. The automated report becomes a single source of truth that keeps everyone informed regardless of timezone or meeting schedule.
What You'll Need
- Airtable account with a base containing your sales pipeline data (deal name, value, stage, status fields)
- Slack workspace with permissions to create webhooks or use Slack bot tokens
- n8n instance (cloud or self-hosted) to run the automation
- Basic understanding of your sales pipeline stages and corresponding probability percentages
- 10 minutes to configure the template with your specific Airtable base and Slack channel
Quick Setup Guide
Getting this automation running in your environment takes just a few simple steps:
- Download the template using the button above and import it into your n8n instance
- Configure Airtable node with your API key, base ID, and table name containing deal data
- Adjust field mappings to match your Airtable column names for deal value, stage, and status
- Set up Slack connection using a webhook or bot token, specifying your target channel
- Test the workflow with a manual trigger to verify calculations and formatting
- Activate the schedule to run weekly (Monday 9 AM is typical for sales reports)
Pro tip: Before going live, run the automation for a past period to verify calculations match your manual reports. This builds confidence in the system and helps identify any field mapping adjustments needed.
Key Benefits
Save 5-10 hours weekly that sales managers typically spend compiling reports. That's 250-500 hours annually returned to selling and coaching activities.
Eliminate reporting errors from manual spreadsheet calculations. Automated calculations ensure consistent accuracy in pipeline valuation and forecasting.
Improve team alignment with real-time visibility into pipeline health. Everyone sees the same numbers simultaneously, reducing confusion and miscommunication.
Enable data-driven decisions with consistent metrics week over week. Track trends in win rates, deal sizes, and pipeline velocity to optimize sales processes.
Scale reporting effortlessly as your team grows. The same automation works for 5 deals or 5,000 without additional manual effort.