What This Workflow Does
This automation solves a critical pain point for investment professionals, analysts, and finance teams: the time-consuming, manual process of creating regular equity research reports. Traditionally, analysts spend hours each week collecting financial data, reading news, calculating ratios, and writing analysis—a repetitive process prone to human error and inconsistency.
The workflow automatically generates professional, data-driven equity research reports for selected companies on a weekly schedule. It pulls five years of financial statements from Financial Modeling Prep, gathers recent market news via NewsAPI, calculates key financial signals, uses OpenAI to generate SWOT analysis and risk assessments, compiles everything into a clean HTML report, converts it to PDF, and emails it to stakeholders—all without manual intervention.
By automating the data collection, calculation, and initial analysis phases, this workflow ensures consistent, unbiased reporting while freeing up analysts to focus on higher-value strategic decisions and portfolio management.
How It Works
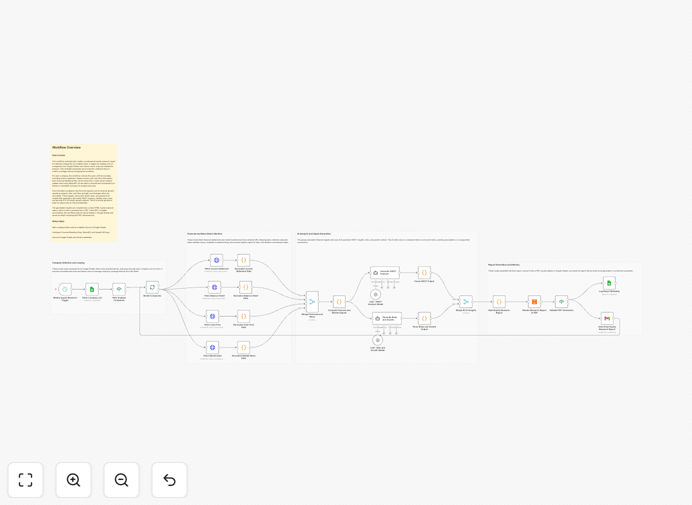
The automation follows a logical pipeline that transforms raw data into actionable investment insights.
1. Weekly Trigger & Company Selection
A schedule trigger initiates the workflow weekly. It first reads a Google Sheet that acts as a control panel, identifying which companies are marked as "enabled" for analysis. This allows you to easily manage your research universe without modifying the automation itself.
2. Financial Data Collection
For each enabled company, the workflow queries the Financial Modeling Prep API to retrieve five years of income statements, balance sheets, and cash flow statements. This provides the fundamental data needed for ratio analysis and trend identification.
3. Market News Aggregation
Simultaneously, the workflow searches NewsAPI for recent headlines and articles about the company. This captures market sentiment, recent developments, and potential catalysts that might not yet be reflected in financial statements.
4. Data Processing & Signal Calculation
The raw financial data is normalized and structured. Key metrics are calculated automatically: revenue growth rates, profit margins, debt-to-equity ratios, cash flow strength, buyback activity, and other valuation indicators. These quantitative signals form the objective foundation for the analysis.
5. AI-Powered Analysis Generation
The calculated signals and aggregated news are fed to OpenAI's language model with carefully crafted prompts. The AI generates a structured SWOT analysis (Strengths, Weaknesses, Opportunities, Threats), identifies key risks, and provides a 12–24 month growth outlook based purely on the data provided.
6. Report Assembly & Distribution
The financial data, calculated signals, and AI insights are compiled into a professional HTML report template. This report is converted to PDF for easy sharing and archiving. Metadata (PDF URL, generation timestamp, file size) is logged back to Google Sheets for tracking, and the final report is emailed to designated stakeholders.
Who This Is For
This automation delivers the most value to professionals and teams who regularly produce equity research and need to scale their analysis efficiently.
Investment Analysts & Research Teams: Automate the routine data gathering and initial analysis for your coverage universe, allowing you to focus on deeper due diligence and investment recommendations.
Financial Advisors & Wealth Managers: Provide clients with consistent, data-backed updates on their holdings without increasing your team's workload. The automated reports serve as excellent client communication tools.
Corporate Finance & Strategy Teams: Monitor competitors and industry peers systematically. The workflow can be adapted to track key metrics across your competitive landscape rather than just investment targets.
Startup Founders & Business Owners: Understand public company benchmarks in your industry. While not for investment purposes, the automated analysis helps you track how public competitors are performing on key financial metrics.
Academic & Research Institutions: Generate consistent datasets for financial research projects or teaching materials about company analysis and valuation techniques.
What You'll Need
- n8n instance (cloud or self-hosted) with workflow execution capabilities
- Google Sheets API access with credentials to read/write to your research control sheet
- Financial Modeling Prep API key for financial statement data (free tier available)
- NewsAPI key for market news aggregation
- OpenAI API access with GPT-4 or similar model for analysis generation
- HTML-to-PDF service credentials (like PDFShift, DocRaptor, or similar)
- Gmail OAuth2 credentials or SMTP access for email distribution
- A Google Sheet with company tickers and an "enabled" column to control the analysis
Pro tip: Start with just 2-3 companies in your control sheet to test the workflow end-to-end before scaling to your full coverage list. This helps identify any API rate limits or formatting issues early.
Quick Setup Guide
Follow these steps to implement this automation in your n8n environment:
- Download and import the JSON template file into your n8n instance.
- Create your control Google Sheet with columns for company ticker, name, and an "enabled" flag (TRUE/FALSE).
- Configure all credential nodes with your API keys for FMP, NewsAPI, OpenAI, and your PDF service.
- Set up the Google Sheets node to point to your control sheet and map the correct columns.
- Customize the AI prompts in the OpenAI nodes to match your preferred analysis style and focus areas.
- Test with one company by setting the "enabled" flag to TRUE and running the workflow manually.
- Review the output and adjust any calculations or formatting in the HTML template node as needed.
- Configure the schedule trigger to run weekly (e.g., Monday mornings before market open).
- Set up the email distribution with your recipient list and preferred email template.
- Monitor the first few automated runs to ensure all API calls complete successfully and reports are generated correctly.
Key Benefits
Save 10-15 hours per week per analyst by automating data collection, calculation, and initial report drafting. What used to take hours for each company now happens automatically while your team focuses on higher-value analysis.
Eliminate manual data entry errors that can skew financial ratios and valuation metrics. Automated calculations ensure consistency and accuracy across all reports, removing human transcription mistakes.
Scale your coverage universe without linearly increasing headcount. Track 50 companies as easily as 5, with each receiving the same rigorous, data-backed analysis on schedule.
Create an audit trail of all analysis with timestamps, data sources, and calculation methodologies. Every report is reproducible and traceable back to the original financial statements.
React faster to market events with automated news monitoring. The system detects and incorporates relevant news immediately, rather than waiting for the next manual research cycle.